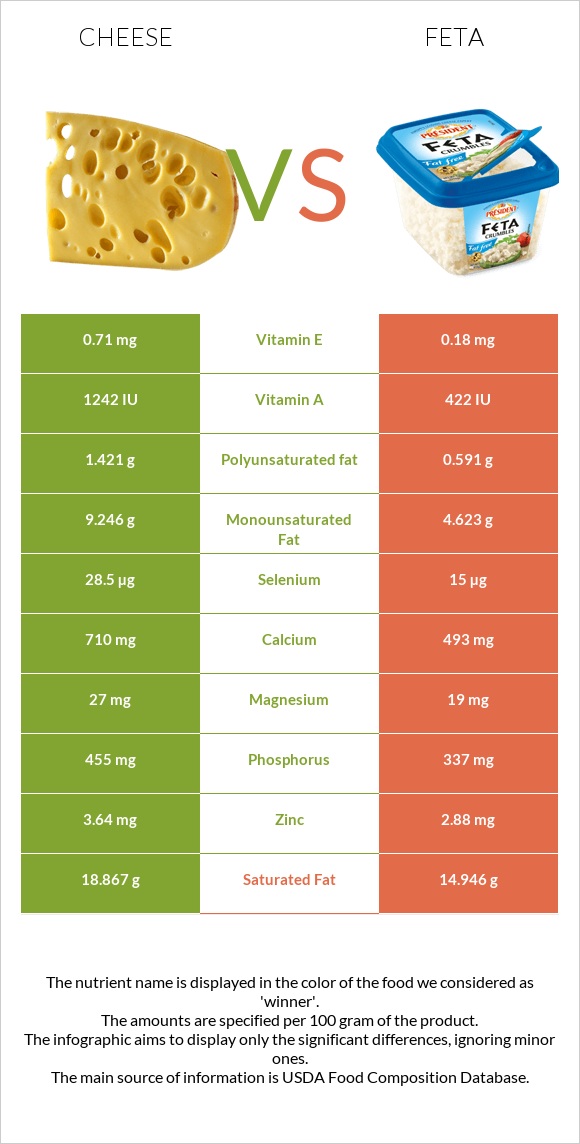
How are cheese and feta different? Cheese has more selenium, calcium, phosphorus, and vitamin A; however, feta is richer in vitamin B2, vitamin B6, vitamin B12, and vitamin B5. Feta covers your daily need for vitamin B2, 32% more than cheese. Cheese has 3 times more vitamin A than feta. Cheese has 1242 IU of vitamin A, while feta has 422 IU. Feta contains less saturated fat. Feta has a higher glycemic index. The glycemic index of feta is 27, while the glycemic index of cheese is 0. Cheese, cheddar and Cheese, feta types were used in this article.
Infographic
Mineral Comparison
Mineral comparison score is based on the number of minerals by which one or the other food is richer. The "coverage" charts below show how much of the daily needs can be covered by 300 grams of the food.
7
100 g
300 g
1 cubic inch - 17g 1 slice (1 oz) - 28g 1 oz - 28.35g 1 cup, shredded - 113g 1 cup, diced - 132g 1 cup, melted - 244g
Magnesium
Magnesium
Calcium
Calcium
Potassium
Potassium
Iron
Iron
Copper
Copper
Zinc
Zinc
Phosphorus
Phosphorus
Sodium
Sodium
Manganese
Manganese
Selenium
Selenium
19%
213%
6.7%
5.3%
10%
99%
195%
85%
3.5%
155%
1
100 g
300 g
1 cubic inch - 17g 1 oz - 28.35g 1 wedge (1.33 oz) - 38g 1 cup, crumbled - 150g
Magnesium
Magnesium
Calcium
Calcium
Potassium
Potassium
Iron
Iron
Copper
Copper
Zinc
Zinc
Phosphorus
Phosphorus
Sodium
Sodium
Manganese
Manganese
Selenium
Selenium
14%
148%
5.5%
24%
11%
79%
144%
120%
3.7%
82%
Vitamin Comparison
Vitamin comparison score is based on the number of vitamins by which one or the other food is richer. The "coverage" charts below show how much of the daily needs can be covered by 300 grams of the food.
4
100 g
300 g
1 cubic inch - 17g 1 slice (1 oz) - 28g 1 oz - 28.35g 1 cup, shredded - 113g 1 cup, diced - 132g 1 cup, melted - 244g
Vitamin C
Vit. C
Vitamin D
Vit. D
Vitamin A
Vit. A
Vitamin E
Vit. E
Vitamin B1
Vit. B1
Vitamin B2
Vit. B2
Vitamin B3
Vit. B3
Vitamin B5
Vit. B5
Vitamin B6
Vit. B6
Vitamin B12
Vit. B12
Vitamin K
Vit. K
Folate
Folate
0%
9%
110%
14%
7.3%
99%
1.1%
25%
15%
138%
6%
20%
7
100 g
300 g
1 cubic inch - 17g 1 oz - 28.35g 1 wedge (1.33 oz) - 38g 1 cup, crumbled - 150g
Vitamin C
Vit. C
Vitamin D
Vit. D
Vitamin A
Vit. A
Vitamin E
Vit. E
Vitamin B1
Vit. B1
Vitamin B2
Vit. B2
Vitamin B3
Vit. B3
Vitamin B5
Vit. B5
Vitamin B6
Vit. B6
Vitamin B12
Vit. B12
Vitamin K
Vit. K
Folate
Folate
0%
6%
42%
3.6%
39%
195%
19%
58%
98%
211%
4.5%
24%
All nutrients comparison - raw data values
Nutrient
DV% diff.
Vitamin B2
0.428mg
0.844mg
32%
Vitamin B6
0.066mg
0.424mg
28%
Selenium
28.5µg
15µg
25%
Vitamin B12
1.1µg
1.69µg
25%
Vitamin A
330µg
125µg
23%
Calcium
710mg
493mg
22%
Fats
33.31g
21.28g
19%
Saturated fat
18.867g
14.946g
18%
Protein
22.87g
14.21g
17%
Phosphorus
455mg
337mg
17%
Monounsaturated fat
9.246g
4.623g
12%
Sodium
653mg
917mg
11%
Vitamin B5
0.41mg
0.967mg
11%
Vitamin B1
0.029mg
0.154mg
10%
Calories
404kcal
264kcal
7%
Zinc
3.64mg
2.88mg
7%
Iron
0.14mg
0.65mg
6%
Vitamin B3
0.059mg
0.991mg
6%
Polyunsaturated fat
1.421g
0.591g
6%
Vitamin E
0.71mg
0.18mg
4%
Cholesterol
99mg
89mg
3%
Magnesium
27mg
19mg
2%
Vitamin D*
24 IU
16 IU
1%
Vitamin D
0.6µg
0.4µg
1%
Vitamin K
2.4µg
1.8µg
1%
Folate
27µg
32µg
1%
Protein per 100 calories
5.7g
5.4g
N/A
Calories per 10 g protein
177kcal
186kcal
N/A
Weight per 100 calories
25g
38g
N/A
Unsaturated / Saturated Fat ratio
0.57
0.35
N/A
Net carbs
3.09g
4.09g
N/A
Carbs
3.09g
4.09g
0%
Potassium
76mg
62mg
0%
Sugar
0.48g
4.09g
N/A
Copper
0.03mg
0.032mg
0%
Manganese
0.027mg
0.028mg
0%
Trans fat
0.917g
N/A
Choline
16.5mg
15.4mg
0%
Tryptophan
0.547mg
0.2mg
0%
Threonine
1.044mg
0.637mg
0%
Isoleucine
1.206mg
0.803mg
0%
Leucine
1.939mg
1.395mg
0%
Lysine
1.025mg
1.219mg
0%
Methionine
0.547mg
0.368mg
0%
Phenylalanine
1.074mg
0.675mg
0%
Valine
1.404mg
1.065mg
0%
Histidine
0.547mg
0.397mg
0%
Omega-3 - EPA
0.01g
0g
N/A
Omega-3 - DHA
0.001g
0g
N/A
Omega-3 - DPA
0.017g
0g
N/A
Omega-6 - Eicosadienoic acid
0.007g
N/A
Macronutrient Comparison
Macronutrient breakdown side-by-side comparison
2
23%
33%
3%
37%
4%
Protein:
22.87 g
Fats:
33.31 g
Carbs:
3.09 g
Water:
37.02 g
Other:
3.71 g
3
14%
21%
4%
55%
5%
Protein:
14.21 g
Fats:
21.28 g
Carbs:
4.09 g
Water:
55.22 g
Other:
5.2 g
Contains
more
Protein Protein
+60.9%
Contains
more
Fats Fats
+56.5%
Contains
more
Carbs Carbs
+32.4%
Contains
more
Water Water
+49.2%
Contains
more
Other Other
+40.2%
Fat Type Comparison
Fat type breakdown side-by-side comparison
2
64%
31%
5%
Saturated fat:
Sat. Fat
18.867 g
Monounsaturated fat:
Mono. Fat
9.246 g
Polyunsaturated fat:
Poly. Fat
1.421 g
1
74%
23%
3%
Saturated fat:
Sat. Fat
14.946 g
Monounsaturated fat:
Mono. Fat
4.623 g
Polyunsaturated fat:
Poly. Fat
0.591 g
Contains
more
Mono. Fat Monounsaturated fat
+100%
Contains
more
Poly. Fat Polyunsaturated fat
+140.4%
Contains
less
Sat. Fat Saturated fat
-20.8%