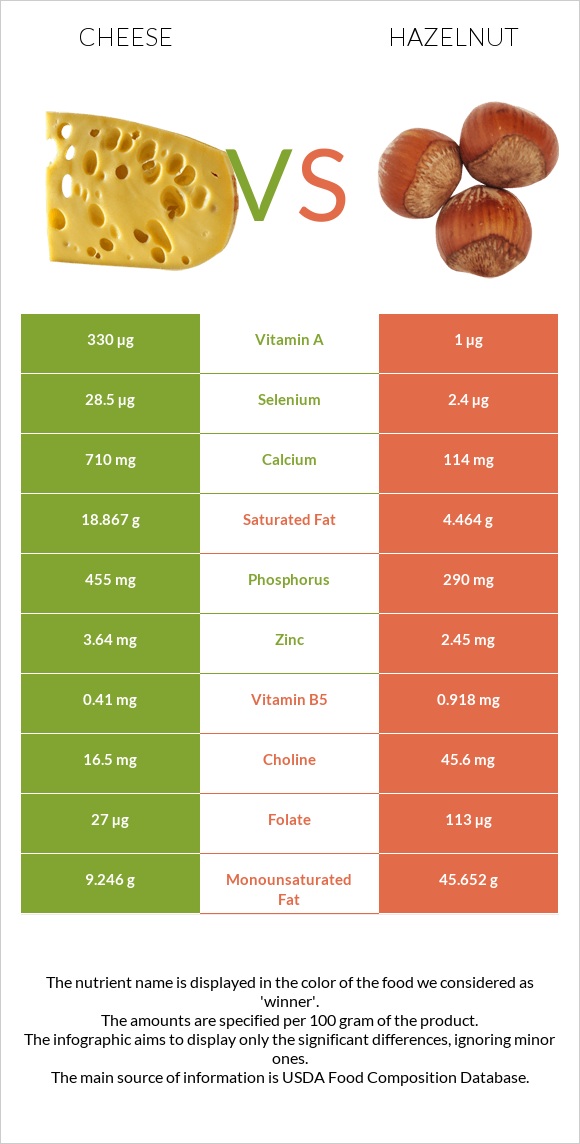
How are cheese and hazelnut different? Cheese is higher in calcium, selenium, and vitamin B12; however, hazelnut is richer in manganese, copper, vitamin E, iron, vitamin B1, and fiber. Daily need coverage for manganese for hazelnut is 267% higher. Hazelnut has less saturated fat. Cheese has a lower glycemic index (0) than hazelnut (15). Cheese, cheddar and Nuts, hazelnuts or filberts are the varieties used in this article.
Infographic
Mineral Comparison
Mineral comparison score is based on the number of minerals by which one or the other food is richer. The "coverage" charts below show how much of the daily needs can be covered by 300 grams of the food.
4
100 g
300 g
1 cubic inch - 17g 1 slice (1 oz) - 28g 1 oz - 28.35g 1 cup, shredded - 113g 1 cup, diced - 132g 1 cup, melted - 244g
Magnesium
Magnesium
Calcium
Calcium
Potassium
Potassium
Iron
Iron
Copper
Copper
Zinc
Zinc
Phosphorus
Phosphorus
Sodium
Sodium
Manganese
Manganese
Selenium
Selenium
19%
213%
6.7%
5.3%
10%
99%
195%
85%
3.5%
155%
6
100 g
300 g
10 nuts - 14g 1 oz (21 whole kernels) - 28.35g 1 cup, ground - 75g 1 cup, chopped - 115g 1 cup, whole - 135g
Magnesium
Magnesium
Calcium
Calcium
Potassium
Potassium
Iron
Iron
Copper
Copper
Zinc
Zinc
Phosphorus
Phosphorus
Sodium
Sodium
Manganese
Manganese
Selenium
Selenium
116%
34%
60%
176%
575%
67%
124%
0%
805%
13%
Vitamin Comparison
Vitamin comparison score is based on the number of vitamins by which one or the other food is richer. The "coverage" charts below show how much of the daily needs can be covered by 300 grams of the food.
4
100 g
300 g
1 cubic inch - 17g 1 slice (1 oz) - 28g 1 oz - 28.35g 1 cup, shredded - 113g 1 cup, diced - 132g 1 cup, melted - 244g
Vitamin C
Vit. C
Vitamin D
Vit. D
Vitamin A
Vit. A
Vitamin E
Vit. E
Vitamin B1
Vit. B1
Vitamin B2
Vit. B2
Vitamin B3
Vit. B3
Vitamin B5
Vit. B5
Vitamin B6
Vit. B6
Vitamin B12
Vit. B12
Vitamin K
Vit. K
Folate
Folate
0%
9%
110%
14%
7.3%
99%
1.1%
25%
15%
138%
6%
20%
8
100 g
300 g
10 nuts - 14g 1 oz (21 whole kernels) - 28.35g 1 cup, ground - 75g 1 cup, chopped - 115g 1 cup, whole - 135g
Vitamin C
Vit. C
Vitamin D
Vit. D
Vitamin A
Vit. A
Vitamin E
Vit. E
Vitamin B1
Vit. B1
Vitamin B2
Vit. B2
Vitamin B3
Vit. B3
Vitamin B5
Vit. B5
Vitamin B6
Vit. B6
Vitamin B12
Vit. B12
Vitamin K
Vit. K
Folate
Folate
21%
0%
0.33%
301%
161%
26%
34%
55%
130%
0%
36%
85%
All nutrients comparison - raw data values
Nutrient
DV% diff.
Manganese
0.027mg
6.175mg
267%
Copper
0.03mg
1.725mg
188%
Vitamin E
0.71mg
15.03mg
95%
Monounsaturated fat
9.246g
45.652g
91%
Saturated fat
18.867g
4.464g
65%
Calcium
710mg
114mg
60%
Iron
0.14mg
4.7mg
57%
Vitamin B1
0.029mg
0.643mg
51%
Selenium
28.5µg
2.4µg
47%
Vitamin B12
1.1µg
0µg
46%
Polyunsaturated fat
1.421g
7.92g
43%
Fats
33.31g
60.75g
42%
Fiber
0g
9.7g
39%
Vitamin B6
0.066mg
0.563mg
38%
Vitamin A
330µg
1µg
37%
Cholesterol
99mg
0mg
33%
Magnesium
27mg
163mg
32%
Sodium
653mg
0mg
28%
Phosphorus
455mg
290mg
24%
Vitamin B2
0.428mg
0.113mg
24%
Folate
27µg
113µg
22%
Potassium
76mg
680mg
18%
Protein
22.87g
14.95g
16%
Calories
404kcal
628kcal
11%
Zinc
3.64mg
2.45mg
11%
Vitamin B3
0.059mg
1.8mg
11%
Vitamin B5
0.41mg
0.918mg
10%
Vitamin K
2.4µg
14.2µg
10%
Vitamin C
0mg
6.3mg
7%
Carbs
3.09g
16.7g
5%
Choline
16.5mg
45.6mg
5%
Vitamin D*
24 IU
0 IU
3%
Vitamin D
0.6µg
0µg
3%
Protein per 100 calories
5.7g
2.4g
N/A
Calories per 10 g protein
177kcal
420kcal
N/A
Weight per 100 calories
25g
16g
N/A
Unsaturated / Saturated Fat ratio
0.57
12
N/A
Net carbs
3.09g
7g
N/A
Sugar
0.48g
4.34g
N/A
Starch
0.48g
0%
Trans fat
0.917g
N/A
Tryptophan
0.547mg
0.193mg
0%
Threonine
1.044mg
0.497mg
0%
Isoleucine
1.206mg
0.545mg
0%
Leucine
1.939mg
1.063mg
0%
Lysine
1.025mg
0.42mg
0%
Methionine
0.547mg
0.221mg
0%
Phenylalanine
1.074mg
0.663mg
0%
Valine
1.404mg
0.701mg
0%
Histidine
0.547mg
0.432mg
0%
Fructose
0g
0.07g
0%
Omega-3 - EPA
0.01g
0g
N/A
Omega-3 - DHA
0.001g
0g
N/A
Omega-3 - DPA
0.017g
0g
N/A
Omega-6 - Eicosadienoic acid
0.007g
0g
N/A
Macronutrient Comparison
Macronutrient breakdown side-by-side comparison
3
23%
33%
3%
37%
4%
Protein:
22.87 g
Fats:
33.31 g
Carbs:
3.09 g
Water:
37.02 g
Other:
3.71 g
2
15%
61%
17%
5%
2%
Protein:
14.95 g
Fats:
60.75 g
Carbs:
16.7 g
Water:
5.31 g
Other:
2.29 g
Contains
more
Protein Protein
+53%
Contains
more
Water Water
+597.2%
Contains
more
Other Other
+62%
Contains
more
Fats Fats
+82.4%
Contains
more
Carbs Carbs
+440.5%
Fat Type Comparison
Fat type breakdown side-by-side comparison
0
64%
31%
5%
Saturated fat:
Sat. Fat
18.867 g
Monounsaturated fat:
Mono. Fat
9.246 g
Polyunsaturated fat:
Poly. Fat
1.421 g
3
8%
79%
14%
Saturated fat:
Sat. Fat
4.464 g
Monounsaturated fat:
Mono. Fat
45.652 g
Polyunsaturated fat:
Poly. Fat
7.92 g
Contains
less
Sat. Fat Saturated fat
-76.3%
Contains
more
Mono. Fat Monounsaturated fat
+393.7%
Contains
more
Poly. Fat Polyunsaturated fat
+457.4%
Carbohydrate type comparison
Carbohydrate type breakdown side-by-side comparison
3
54%
25%
21%
Starch:
0 g
Sucrose:
0 g
Glucose:
0.26 g
Fructose:
0 g
Lactose:
0.12 g
Maltose:
0 g
Galactose:
0.1 g
3
10%
87%
Starch:
0.48 g
Sucrose:
4.2 g
Glucose:
0.07 g
Fructose:
0.07 g
Lactose:
0 g
Maltose:
0 g
Galactose:
0 g
Contains
more
Glucose Glucose
+271.4%
Contains
more
Lactose Lactose
+∞%
Contains
more
Galactose Galactose
+∞%
Contains
more
Starch Starch
+∞%
Contains
more
Sucrose Sucrose
+∞%
Contains
more
Fructose Fructose
+∞%