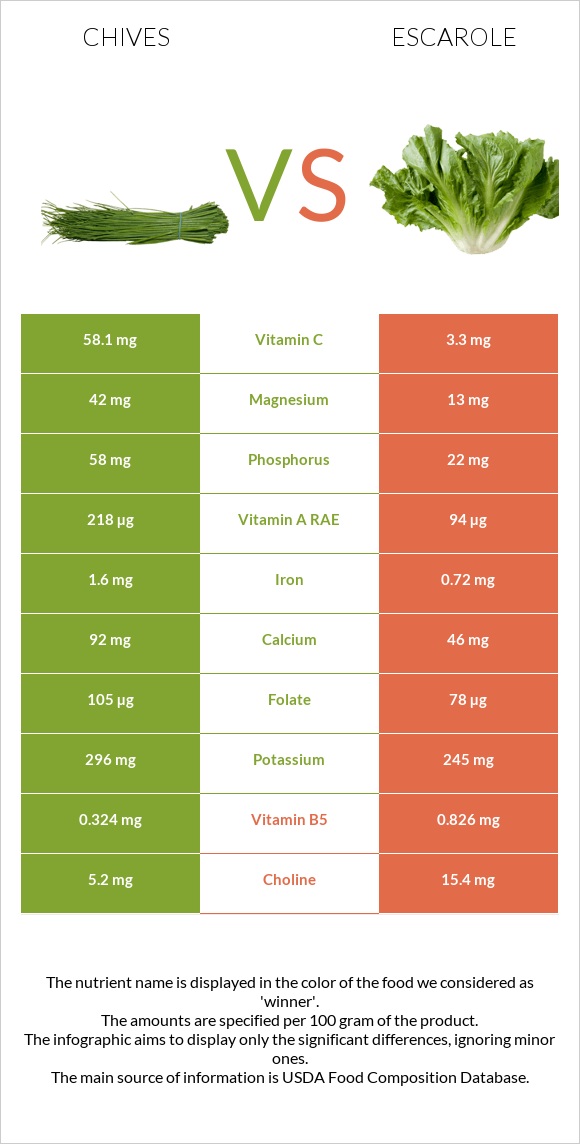
Significant differences between chives and escarole Chives have more vitamin C, vitamin A, iron, vitamin B6, copper, magnesium, folate, and phosphorus; however, escarole is richer in vitamin B5. Chives cover your daily vitamin C needs 61% more than escarole. Escarole has 9 times less vitamin B6 than chives. Chives have 0.138mg of vitamin B6, while escarole has 0.016mg. Chives have a higher glycemic index. The glycemic index of chives is 45, while the glycemic index of escarole is 0. Specific food types used in this comparison are Chives, raw and Escarole, cooked, boiled, drained, no salt added .
Infographic
Mineral Comparison
Mineral comparison score is based on the number of minerals by which one or the other food is richer. The "coverage" charts below show how much of the daily needs can be covered by 300 grams of the food.
8
100 g
300 g
1 tsp chopped - 1g 1 tbsp chopped - 3g
Magnesium
Magnesium
Calcium
Calcium
Potassium
Potassium
Iron
Iron
Copper
Copper
Zinc
Zinc
Phosphorus
Phosphorus
Sodium
Sodium
Manganese
Manganese
Selenium
Selenium
30%
28%
26%
60%
52%
15%
25%
0.39%
49%
4.9%
1
100 g
300 g
1 cup - 150g
Magnesium
Magnesium
Calcium
Calcium
Potassium
Potassium
Iron
Iron
Copper
Copper
Zinc
Zinc
Phosphorus
Phosphorus
Sodium
Sodium
Manganese
Manganese
Selenium
Selenium
9.3%
14%
22%
27%
29%
19%
9.4%
2.5%
50%
1.1%
Vitamin Comparison
Vitamin comparison score is based on the number of vitamins by which one or the other food is richer. The "coverage" charts below show how much of the daily needs can be covered by 300 grams of the food.
7
100 g
300 g
1 tsp chopped - 1g 1 tbsp chopped - 3g
Vitamin C
Vit. C
Vitamin D
Vit. D
Vitamin A
Vit. A
Vitamin E
Vit. E
Vitamin B1
Vit. B1
Vitamin B2
Vit. B2
Vitamin B3
Vit. B3
Vitamin B5
Vit. B5
Vitamin B6
Vit. B6
Vitamin B12
Vit. B12
Vitamin K
Vit. K
Folate
Folate
194%
0%
73%
4.2%
20%
27%
12%
19%
32%
0%
532%
79%
2
100 g
300 g
1 cup - 150g
Vitamin C
Vit. C
Vitamin D
Vit. D
Vitamin A
Vit. A
Vitamin E
Vit. E
Vitamin B1
Vit. B1
Vitamin B2
Vit. B2
Vitamin B3
Vit. B3
Vitamin B5
Vit. B5
Vitamin B6
Vit. B6
Vitamin B12
Vit. B12
Vitamin K
Vit. K
Folate
Folate
11%
0%
31%
8%
15%
14%
5.9%
50%
3.7%
0%
530%
59%
All nutrients comparison - raw data values
Nutrient
DV% diff.
Vitamin C
58.1mg
3.3mg
61%
Vitamin A
218µg
94µg
14%
Iron
1.6mg
0.72mg
11%
Vitamin B5
0.324mg
0.826mg
10%
Vitamin B6
0.138mg
0.016mg
9%
Copper
0.157mg
0.087mg
8%
Magnesium
42mg
13mg
7%
Folate
105µg
78µg
7%
Calcium
92mg
46mg
5%
Phosphorus
58mg
22mg
5%
Protein
3.27g
1.15g
4%
Vitamin B2
0.115mg
0.062mg
4%
Potassium
296mg
245mg
2%
Vitamin B1
0.078mg
0.059mg
2%
Vitamin B3
0.647mg
0.312mg
2%
Choline
5.2mg
15.4mg
2%
Calories
30kcal
19kcal
1%
Fats
0.73g
0.18g
1%
Fiber
2.5g
2.8g
1%
Zinc
0.56mg
0.69mg
1%
Sodium
3mg
19mg
1%
Vitamin E
0.21mg
0.4mg
1%
Manganese
0.373mg
0.385mg
1%
Selenium
0.9µg
0.2µg
1%
Vitamin K
212.7µg
211.9µg
1%
Polyunsaturated fat
0.267g
0.081g
1%
Protein per 100 calories
11g
6.1g
N/A
Calories per 10 g protein
92kcal
165kcal
N/A
Weight per 100 calories
333g
526g
N/A
Net carbs
1.85g
0.27g
N/A
Carbs
4.35g
3.07g
0%
Sugar
1.85g
0.23g
N/A
Saturated fat
0.146g
0.042g
0%
Monounsaturated fat
0.095g
0.004g
0%
Tryptophan
0.037mg
0.005mg
0%
Threonine
0.128mg
0.046mg
0%
Isoleucine
0.139mg
0.066mg
0%
Leucine
0.195mg
0.09mg
0%
Lysine
0.163mg
0.058mg
0%
Methionine
0.036mg
0.013mg
0%
Phenylalanine
0.105mg
0.049mg
0%
Valine
0.145mg
0.058mg
0%
Histidine
0.057mg
0.021mg
0%
Macronutrient Comparison
Macronutrient breakdown side-by-side comparison
3
3%
4%
91%
Protein:
3.27 g
Fats:
0.73 g
Carbs:
4.35 g
Water:
90.65 g
Other:
1 g
2
3%
94%
Protein:
1.15 g
Fats:
0.18 g
Carbs:
3.07 g
Water:
94.29 g
Other:
1.31 g
Contains
more
Protein Protein
+184.3%
Contains
more
Fats Fats
+305.6%
Contains
more
Carbs Carbs
+41.7%
Contains
more
Other Other
+31%
Fat Type Comparison
Fat type breakdown side-by-side comparison
2
29%
19%
53%
Saturated fat:
Sat. Fat
0.146 g
Monounsaturated fat:
Mono. Fat
0.095 g
Polyunsaturated fat:
Poly. Fat
0.267 g
1
33%
3%
64%
Saturated fat:
Sat. Fat
0.042 g
Monounsaturated fat:
Mono. Fat
0.004 g
Polyunsaturated fat:
Poly. Fat
0.081 g
Contains
more
Mono. Fat Monounsaturated fat
+2275%
Contains
more
Poly. Fat Polyunsaturated fat
+229.6%
Contains
less
Sat. Fat Saturated fat
-71.2%