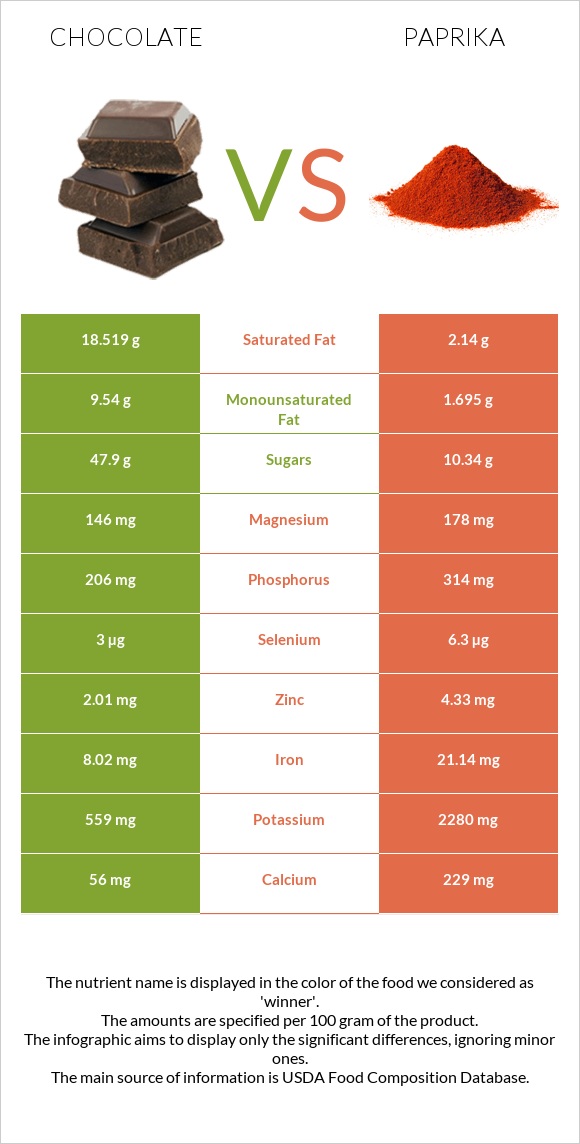
Significant differences between chocolate and paprika The amount of vitamin A, vitamin E, iron, vitamin B6, fiber, vitamin B2, vitamin K, vitamin B3, and potassium in paprika is higher than in chocolate. Paprika covers your daily vitamin A needs 984% more than chocolate. Paprika has 9 times less saturated fat than chocolate. Chocolate has 18.519g of saturated fat, while paprika has 2.14g. Chocolate has a higher glycemic index. The glycemic index of chocolate is 23, while the glycemic index of paprika is 0. Specific food types used in this comparison are Chocolate, dark, 45- 59% cacao solids and Spices, paprika .
Infographic
Mineral Comparison
Mineral comparison score is based on the number of minerals by which one or the other food is richer. The "coverage" charts below show how much of the daily needs can be covered by 300 grams of the food.
2
100 g
300 g
1 oz - 28.35g 1 bar - 162g
Magnesium
Magnesium
Calcium
Calcium
Potassium
Potassium
Iron
Iron
Copper
Copper
Zinc
Zinc
Phosphorus
Phosphorus
Sodium
Sodium
Manganese
Manganese
Selenium
Selenium
104%
17%
49%
301%
343%
55%
88%
3.1%
185%
16%
8
100 g
300 g
0.25 tsp - 0.5g 1 tbsp - 6.8g
Magnesium
Magnesium
Calcium
Calcium
Potassium
Potassium
Iron
Iron
Copper
Copper
Zinc
Zinc
Phosphorus
Phosphorus
Sodium
Sodium
Manganese
Manganese
Selenium
Selenium
127%
69%
201%
793%
238%
118%
135%
8.9%
207%
34%
Vitamin Comparison
Vitamin comparison score is based on the number of vitamins by which one or the other food is richer. The "coverage" charts below show how much of the daily needs can be covered by 300 grams of the food.
1
100 g
300 g
1 oz - 28.35g 1 bar - 162g
Vitamin C
Vit. C
Vitamin D
Vit. D
Vitamin A
Vit. A
Vitamin E
Vit. E
Vitamin B1
Vit. B1
Vitamin B2
Vit. B2
Vitamin B3
Vit. B3
Vitamin B5
Vit. B5
Vitamin B6
Vit. B6
Vitamin B12
Vit. B12
Vitamin K
Vit. K
Folate
Folate
0%
0%
0.67%
11%
6.3%
12%
14%
18%
9.7%
29%
20%
0%
10
100 g
300 g
0.25 tsp - 0.5g 1 tbsp - 6.8g
Vitamin C
Vit. C
Vitamin D
Vit. D
Vitamin A
Vit. A
Vitamin E
Vit. E
Vitamin B1
Vit. B1
Vitamin B2
Vit. B2
Vitamin B3
Vit. B3
Vitamin B5
Vit. B5
Vitamin B6
Vit. B6
Vitamin B12
Vit. B12
Vitamin K
Vit. K
Folate
Folate
3%
0%
821%
582%
83%
284%
189%
151%
494%
0%
201%
37%
All nutrients comparison - raw data values
Nutrient
DV% diff.
Vitamin A
2µg
2463µg
273%
Vitamin E
0.54mg
29.1mg
190%
Iron
8.02mg
21.14mg
164%
Vitamin B6
0.042mg
2.141mg
161%
Fiber
7g
34.9g
112%
Vitamin B2
0.05mg
1.23mg
91%
Saturated fat
18.519g
2.14g
74%
Vitamin K
8.1µg
80.3µg
60%
Vitamin B3
0.725mg
10.06mg
58%
Potassium
559mg
2280mg
51%
Vitamin B5
0.297mg
2.51mg
44%
Polyunsaturated fat
1.092g
7.766g
44%
Copper
1.028mg
0.713mg
35%
Fats
31.28g
12.89g
28%
Vitamin B1
0.025mg
0.33mg
25%
Zinc
2.01mg
4.33mg
21%
Monounsaturated fat
9.54g
1.695g
20%
Protein
4.88g
14.14g
19%
Calcium
56mg
229mg
17%
Phosphorus
206mg
314mg
15%
Calories
546kcal
282kcal
13%
Folate
49µg
12%
Caffeine
43mg
0mg
11%
Vitamin B12
0.23µg
0µg
10%
Choline
51.5mg
9%
Magnesium
146mg
178mg
8%
Fructose
0g
6.71g
8%
Manganese
1.419mg
1.59mg
7%
Selenium
3µg
6.3µg
6%
Cholesterol
8mg
0mg
3%
Carbs
61.17g
53.99g
2%
Sodium
24mg
68mg
2%
Vitamin C
0.9mg
1%
Protein per 100 calories
0.89g
5g
N/A
Calories per 10 g protein
1119kcal
199kcal
N/A
Weight per 100 calories
18g
35g
N/A
Unsaturated / Saturated Fat ratio
0.57
4.4
N/A
Net carbs
54.17g
19.09g
N/A
Sugar
47.9g
10.34g
N/A
Trans fat
0.112g
0g
N/A
Tryptophan
0.07mg
0%
Threonine
0.49mg
0%
Isoleucine
0.57mg
0%
Leucine
0.92mg
0%
Lysine
0.69mg
0%
Methionine
0.2mg
0%
Phenylalanine
0.61mg
0%
Valine
0.75mg
0%
Histidine
0.25mg
0%
Omega-3 - EPA
0.001g
0g
N/A
Omega-3 - ALA
0.085g
0.453g
N/A
Omega-6 - Eicosadienoic acid
0.001g
0g
N/A
Omega-6 - Linoleic acid
0.947g
N/A
Macronutrient Comparison
Macronutrient breakdown side-by-side comparison
2
5%
31%
61%
2%
Protein:
4.88 g
Fats:
31.28 g
Carbs:
61.17 g
Water:
0.97 g
Other:
1.7 g
3
14%
13%
54%
11%
8%
Protein:
14.14 g
Fats:
12.89 g
Carbs:
53.99 g
Water:
11.24 g
Other:
7.74 g
Contains
more
Fats Fats
+142.7%
Contains
more
Carbs Carbs
+13.3%
Contains
more
Protein Protein
+189.8%
Contains
more
Water Water
+1058.8%
Contains
more
Other Other
+355.3%
Fat Type Comparison
Fat type breakdown side-by-side comparison
1
64%
33%
4%
Saturated fat:
Sat. Fat
18.519 g
Monounsaturated fat:
Mono. Fat
9.54 g
Polyunsaturated fat:
Poly. Fat
1.092 g
2
18%
15%
67%
Saturated fat:
Sat. Fat
2.14 g
Monounsaturated fat:
Mono. Fat
1.695 g
Polyunsaturated fat:
Poly. Fat
7.766 g
Contains
more
Mono. Fat Monounsaturated fat
+462.8%
Contains
less
Sat. Fat Saturated fat
-88.4%
Contains
more
Poly. Fat Polyunsaturated fat
+611.2%
Carbohydrate type comparison
Carbohydrate type breakdown side-by-side comparison
2
97%
3%
Starch:
0 g
Sucrose:
46.25 g
Glucose:
0 g
Fructose:
0 g
Lactose:
1.65 g
Maltose:
0 g
Galactose:
0 g
3
8%
25%
65%
2%
Starch:
0 g
Sucrose:
0.81 g
Glucose:
2.63 g
Fructose:
6.71 g
Lactose:
0 g
Maltose:
0 g
Galactose:
0.19 g
Contains
more
Sucrose Sucrose
+5609.9%
Contains
more
Lactose Lactose
+∞%
Contains
more
Glucose Glucose
+∞%
Contains
more
Fructose Fructose
+∞%
Contains
more
Galactose Galactose
+∞%
~equal in
Starch
~0g
~equal in
Maltose
~0g