
Croissants, cheese vs. French toast — In-Depth Nutrition Comparison
Compare
Significant differences between croissants, cheese and french toast
- The amount of vitamin B1, fats, selenium, vitamin A, folate, carbs, manganese, and iron in croissants, cheese is higher than in french toast.
- Croissants, cheese covers your daily saturated fat needs 40% more than french toast.
- French toast has 3 times less vitamin B1 than croissants, cheese. Croissants, cheese has 0.523mg of vitamin B1, while french toast has 0.204mg.
- French toast contains less saturated fat.
Specific food types used in this comparison are Croissants, cheese and French toast, prepared from recipe, made with low fat (2%) milk.
Infographic
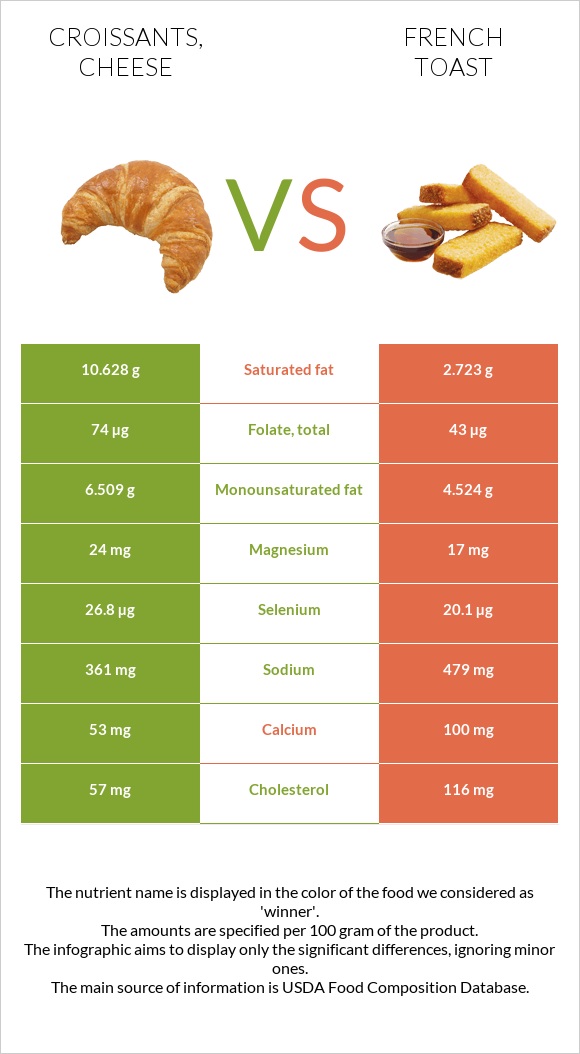
Infographic link
Mineral Comparison
The mineral comparison score is based on which food has a more favorable amount of each mineral. The �coverage� charts below show how much of the daily mineral needs are covered by the selected amount of each food.
| Contains more MagnesiumMagnesium | +41.2% |
| Contains more IronIron | +28.7% |
| Contains more CopperCopper | +72.4% |
| Contains more ZincZinc | +40.3% |
| Contains less SodiumSodium | -24.6% |
| Contains more ManganeseManganese | +80.9% |
| Contains more SeleniumSelenium | +33.3% |
| Contains more CalciumCalcium | +88.7% |
Vitamin Comparison
The vitamin comparison score is based on the number of vitamins in which one food is richer than the other. The �coverage� charts below show how much of the daily vitamin needs are covered by the selected amount of each food.
| Contains more Vitamin AVitamin A | +64.5% |
| Contains more Vitamin EVitamin E | +∞% |
| Contains more Vitamin B1Vitamin B1 | +156.4% |
| Contains more Vitamin B3Vitamin B3 | +32.7% |
| Contains more Vitamin B5Vitamin B5 | +53.4% |
| Contains more Vitamin KVitamin K | +∞% |
| Contains more FolateFolate | +72.1% |
| Contains more Vitamin CVitamin C | +50% |
All nutrients comparison - raw data values
| Nutrient |  |
 |
DV% diff. |
| Saturated fat | 10.628g | 2.723g | 36% |
| Vitamin B1 | 0.523mg | 0.204mg | 27% |
| Cholesterol | 57mg | 116mg | 20% |
| Fats | 20.9g | 10.8g | 16% |
| Selenium | 26.8µg | 20.1µg | 12% |
| Fiber | 2.6g | 10% | |
| Vitamin E | 1.44mg | 10% | |
| Calories | 414kcal | 229kcal | 9% |
| Vitamin A | 204µg | 124µg | 9% |
| Vitamin K | 10.9µg | 9% | |
| Folate | 74µg | 43µg | 8% |
| Carbs | 47g | 25g | 7% |
| Manganese | 0.34mg | 0.188mg | 7% |
| Choline | 38.8mg | 7% | |
| Iron | 2.15mg | 1.67mg | 6% |
| Vitamin B5 | 0.842mg | 0.549mg | 6% |
| Calcium | 53mg | 100mg | 5% |
| Copper | 0.1mg | 0.058mg | 5% |
| Sodium | 361mg | 479mg | 5% |
| Monounsaturated fat | 6.509g | 4.524g | 5% |
| Protein | 9.2g | 7.7g | 3% |
| Vitamin B3 | 2.16mg | 1.628mg | 3% |
| Magnesium | 24mg | 17mg | 2% |
| Zinc | 0.94mg | 0.67mg | 2% |
| Phosphorus | 130mg | 117mg | 2% |
| Polyunsaturated fat | 2.384g | 2.594g | 1% |
| Protein per 100 calories | 2.2g | 3.4g | N/A |
| Calories per 10 g protein | 450kcal | 297kcal | N/A |
| Weight per 100 calories | 24g | 44g | N/A |
| Unsaturated / Saturated Fat ratio | 0.84 | 2.6 | N/A |
| Vitamin C | 0.2mg | 0.3mg | 0% |
| Net carbs | 44.4g | 25g | N/A |
| Potassium | 132mg | 134mg | 0% |
| Sugar | 11.35g | N/A | |
| Vitamin B2 | 0.325mg | 0.321mg | 0% |
| Vitamin B6 | 0.073mg | 0.074mg | 0% |
| Vitamin B12 | 0.32µg | 0.31µg | 0% |
| Tryptophan | 0.109mg | 0.094mg | 0% |
| Threonine | 0.304mg | 0.305mg | 0% |
| Isoleucine | 0.407mg | 0.375mg | 0% |
| Leucine | 0.692mg | 0.621mg | 0% |
| Lysine | 0.371mg | 0.413mg | 0% |
| Methionine | 0.187mg | 0.188mg | 0% |
| Phenylalanine | 0.455mg | 0.389mg | 0% |
| Valine | 0.453mg | 0.419mg | 0% |
| Histidine | 0.212mg | 0.179mg | 0% |
| Omega-3 (EPA) | 0.002g | 0.001g | N/A |
| Omega-3 (DHA) | 0.002g | 0.01g | N/A |
Macronutrient Comparison
Macronutrient breakdown side-by-side comparison
Protein:
9.2 g
Fats:
20.9 g
Carbs:
47 g
Water:
21 g
Other:
1.9 g
Protein:
7.7 g
Fats:
10.8 g
Carbs:
25 g
Water:
54.7 g
Other:
1.8 g
| Contains more ProteinProtein | +19.5% |
| Contains more FatsFats | +93.5% |
| Contains more CarbsCarbs | +88% |
| Contains more WaterWater | +160.5% |
Fat Type Comparison
Fat type breakdown side-by-side comparison
Saturated fat:
Sat. Fat
10.628 g
Monounsaturated fat:
Mono. Fat
6.509 g
Polyunsaturated fat:
Poly. Fat
2.384 g
Saturated fat:
Sat. Fat
2.723 g
Monounsaturated fat:
Mono. Fat
4.524 g
Polyunsaturated fat:
Poly. Fat
2.594 g
| Contains more Mono. FatMonounsaturated fat | +43.9% |
| Contains less Sat. FatSaturated fat | -74.4% |
~equal in
Polyunsaturated fat
~2.594g