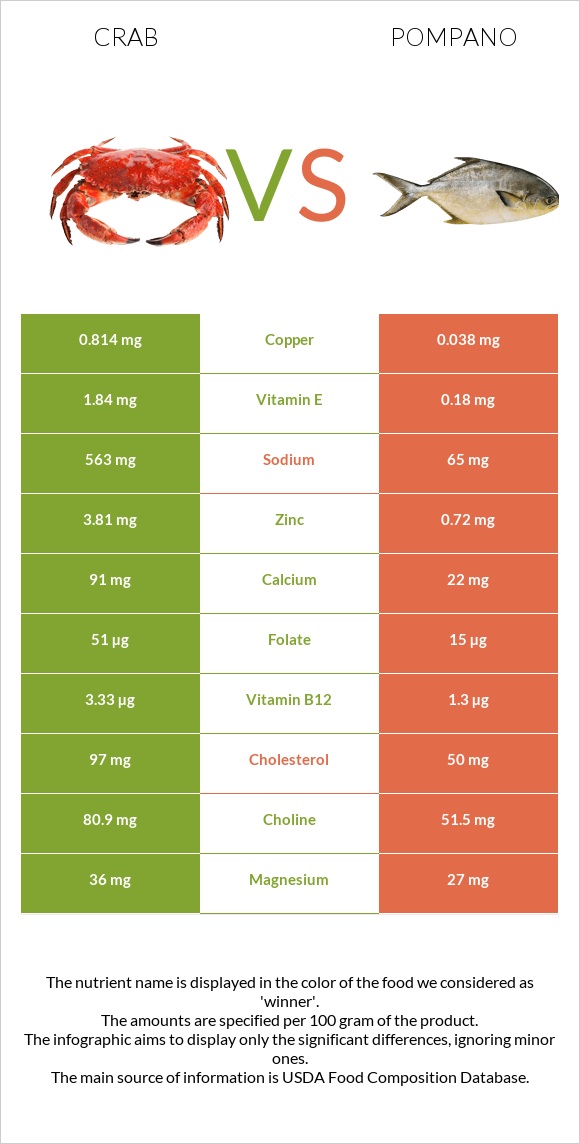
Significant differences between crab and pompano Crab has more vitamin B12, copper, zinc, and folate; however, pompano is richer in vitamin B1, phosphorus, and potassium. Crab covers your daily vitamin B12 needs 89% more than pompano. Pompano has 10 times less copper than crab. Crab has 0.814mg of copper, while pompano has 0.078mg. Pompano contains less sodium. Specific food types used in this comparison are Crustaceans, crab, blue, canned and Fish, pompano, florida, cooked, dry heat .
Infographic
Mineral Comparison
Mineral comparison score is based on the number of minerals by which one or the other food is richer. The "coverage" charts below show how much of the daily needs can be covered by 300 grams of the food.
5
100 g
300 g
1 oz - 28.35g 3 oz - 85g 1 can (6.5 oz), drained - 125g 1 cup - 135g
Magnesium
Magnesium
Calcium
Calcium
Potassium
Potassium
Iron
Iron
Copper
Copper
Zinc
Zinc
Phosphorus
Phosphorus
Sodium
Sodium
Manganese
Manganese
Selenium
Selenium
26%
27%
23%
19%
271%
104%
100%
73%
9.7%
234%
4
100 g
300 g
3 oz - 85g 1 fillet - 88g
Magnesium
Magnesium
Calcium
Calcium
Potassium
Potassium
Iron
Iron
Copper
Copper
Zinc
Zinc
Phosphorus
Phosphorus
Sodium
Sodium
Manganese
Manganese
Selenium
Selenium
22%
13%
56%
25%
26%
19%
146%
9.9%
3.3%
255%
Vitamin Comparison
Vitamin comparison score is based on the number of vitamins by which one or the other food is richer. The "coverage" charts below show how much of the daily needs can be covered by 300 grams of the food.
6
100 g
300 g
1 oz - 28.35g 3 oz - 85g 1 can (6.5 oz), drained - 125g 1 cup - 135g
Vitamin C
Vit. C
Vitamin D
Vit. D
Vitamin A
Vit. A
Vitamin E
Vit. E
Vitamin B1
Vit. B1
Vitamin B2
Vit. B2
Vitamin B3
Vit. B3
Vitamin B5
Vit. B5
Vitamin B6
Vit. B6
Vitamin B12
Vit. B12
Vitamin K
Vit. K
Folate
Folate
11%
0%
0.33%
37%
5.8%
21%
52%
60%
36%
416%
0.75%
38%
5
100 g
300 g
3 oz - 85g 1 fillet - 88g
Vitamin C
Vit. C
Vitamin D
Vit. D
Vitamin A
Vit. A
Vitamin E
Vit. E
Vitamin B1
Vit. B1
Vitamin B2
Vit. B2
Vitamin B3
Vit. B3
Vitamin B5
Vit. B5
Vitamin B6
Vit. B6
Vitamin B12
Vit. B12
Vitamin K
Vit. K
Folate
Folate
0%
0%
12%
0%
170%
35%
71%
52%
53%
150%
0%
13%
All nutrients comparison - raw data values
Nutrient
DV% diff.
Vitamin B12
3.33µg
1.2µg
89%
Copper
0.814mg
0.078mg
82%
Vitamin B1
0.023mg
0.68mg
55%
Zinc
3.81mg
0.69mg
28%
Sodium
563mg
76mg
21%
Saturated fat
0.201g
4.499g
20%
Fats
0.74g
12.14g
18%
Phosphorus
234mg
341mg
15%
Choline
80.9mg
15%
Protein
17.88g
23.69g
12%
Vitamin E
1.84mg
12%
Cholesterol
97mg
64mg
11%
Potassium
259mg
636mg
11%
Folate
51µg
17µg
9%
Monounsaturated fat
0.129g
3.315g
8%
Polyunsaturated fat
0.258g
1.458g
8%
Selenium
42.9µg
46.8µg
7%
Vitamin B3
2.747mg
3.8mg
7%
Calories
83kcal
211kcal
6%
Vitamin B6
0.156mg
0.23mg
6%
Calcium
91mg
43mg
5%
Vitamin C
3.3mg
0mg
4%
Vitamin A
1µg
36µg
4%
Vitamin B2
0.093mg
0.15mg
4%
Vitamin B5
0.997mg
0.87mg
3%
Iron
0.5mg
0.67mg
2%
Manganese
0.074mg
0.025mg
2%
Magnesium
36mg
31mg
1%
Protein per 100 calories
22g
11g
N/A
Calories per 10 g protein
46kcal
89kcal
N/A
Weight per 100 calories
120g
47g
N/A
Unsaturated / Saturated Fat ratio
1.9
1.1
N/A
Vitamin K
0.3µg
0%
Trans fat
0.014g
N/A
Tryptophan
0.226mg
0.265mg
0%
Threonine
0.727mg
1.038mg
0%
Isoleucine
0.776mg
1.092mg
0%
Leucine
1.307mg
1.925mg
0%
Lysine
1.386mg
2.175mg
0%
Methionine
0.452mg
0.701mg
0%
Phenylalanine
0.708mg
0.925mg
0%
Valine
0.806mg
1.22mg
0%
Histidine
0.393mg
0.697mg
0%
Omega-3 - EPA
0.101g
0.224g
N/A
Omega-3 - DHA
0.067g
0.504g
N/A
Omega-3 - DPA
0.009g
0.259g
N/A
Omega-6 - Eicosadienoic acid
0.005g
N/A
Macronutrient Comparison
Macronutrient breakdown side-by-side comparison
2
18%
80%
2%
Protein:
17.88 g
Fats:
0.74 g
Carbs:
0 g
Water:
79.69 g
Other:
1.69 g
2
24%
12%
63%
Protein:
23.69 g
Fats:
12.14 g
Carbs:
0 g
Water:
62.97 g
Other:
1.2 g
Contains
more
Water Water
+26.6%
Contains
more
Other Other
+40.8%
Contains
more
Protein Protein
+32.5%
Contains
more
Fats Fats
+1540.5%
Fat Type Comparison
Fat type breakdown side-by-side comparison
1
34%
22%
44%
Saturated fat:
Sat. Fat
0.201 g
Monounsaturated fat:
Mono. Fat
0.129 g
Polyunsaturated fat:
Poly. Fat
0.258 g
2
49%
36%
16%
Saturated fat:
Sat. Fat
4.499 g
Monounsaturated fat:
Mono. Fat
3.315 g
Polyunsaturated fat:
Poly. Fat
1.458 g
Contains
less
Sat. Fat Saturated fat
-95.5%
Contains
more
Mono. Fat Monounsaturated fat
+2469.8%
Contains
more
Poly. Fat Polyunsaturated fat
+465.1%