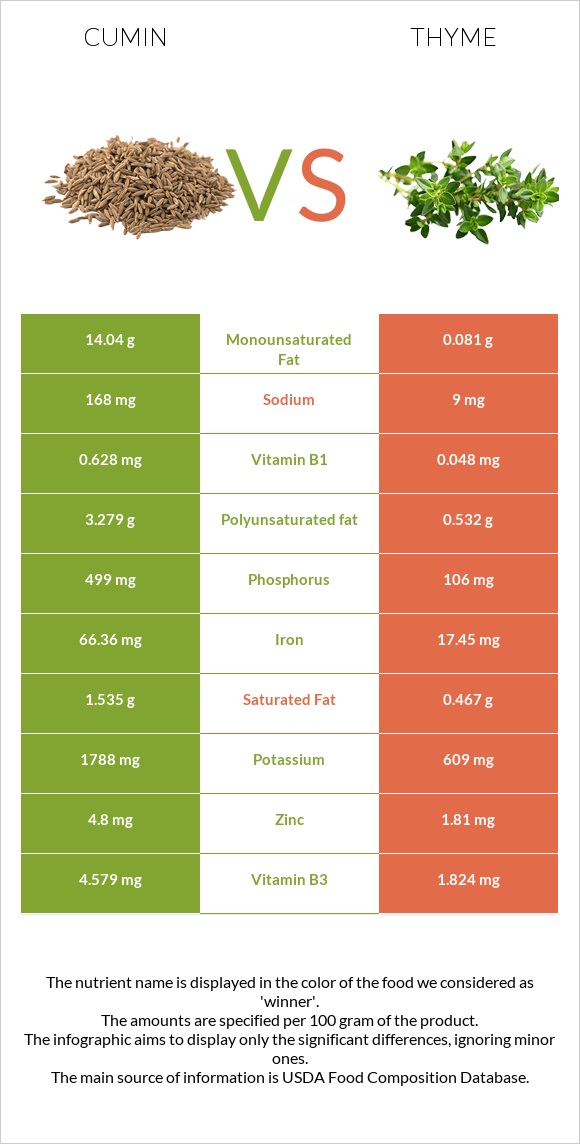
Summary of differences between cumin and thyme Cumin has more iron, manganese, phosphorus, calcium, magnesium, vitamin B1, potassium, and copper; however, thyme is higher in vitamin C and vitamin A. Cumin covers your daily need for iron, 611% more than thyme. Cumin has 13 times more vitamin B1 than thyme. While cumin has 0.628mg of vitamin B1, thyme has only 0.048mg. The glycemic index of thyme is higher. These are the specific foods used in this comparison Spices, cumin seed and Thyme, fresh .
Infographic
Mineral Comparison
Mineral comparison score is based on the number of minerals by which one or the other food is richer. The "coverage" charts below show how much of the daily needs can be covered by 300 grams of the food.
9
100 g
300 g
0.25 tsp, whole - 0.5g 1 tbsp, whole - 6g
Magnesium
Magnesium
Calcium
Calcium
Potassium
Potassium
Iron
Iron
Copper
Copper
Zinc
Zinc
Phosphorus
Phosphorus
Sodium
Sodium
Manganese
Manganese
Selenium
Selenium
261%
279%
158%
2489%
289%
131%
214%
22%
435%
28%
1
100 g
300 g
0.5 tsp - 0.4g 1 tsp - 0.8g
Magnesium
Magnesium
Calcium
Calcium
Potassium
Potassium
Iron
Iron
Copper
Copper
Zinc
Zinc
Phosphorus
Phosphorus
Sodium
Sodium
Manganese
Manganese
Selenium
Selenium
114%
122%
54%
654%
185%
49%
45%
1.2%
224%
0%
Vitamin Comparison
Vitamin comparison score is based on the number of vitamins by which one or the other food is richer. The "coverage" charts below show how much of the daily needs can be covered by 300 grams of the food.
5
100 g
300 g
0.25 tsp, whole - 0.5g 1 tbsp, whole - 6g
Vitamin C
Vit. C
Vitamin D
Vit. D
Vitamin A
Vit. A
Vitamin E
Vit. E
Vitamin B1
Vit. B1
Vitamin B2
Vit. B2
Vitamin B3
Vit. B3
Vitamin B5
Vit. B5
Vitamin B6
Vit. B6
Vitamin B12
Vit. B12
Vitamin K
Vit. K
Folate
Folate
26%
0%
21%
67%
157%
75%
86%
0%
100%
0%
14%
7.5%
5
100 g
300 g
0.5 tsp - 0.4g 1 tsp - 0.8g
Vitamin C
Vit. C
Vitamin D
Vit. D
Vitamin A
Vit. A
Vitamin E
Vit. E
Vitamin B1
Vit. B1
Vitamin B2
Vit. B2
Vitamin B3
Vit. B3
Vitamin B5
Vit. B5
Vitamin B6
Vit. B6
Vitamin B12
Vit. B12
Vitamin K
Vit. K
Folate
Folate
534%
0%
79%
0%
12%
109%
34%
25%
80%
0%
0%
34%
All nutrients comparison - raw data values
Nutrient
DV% diff.
Iron
66.36mg
17.45mg
611%
Vitamin C
7.7mg
160.1mg
169%
Manganese
3.333mg
1.719mg
70%
Phosphorus
499mg
106mg
56%
Calcium
931mg
405mg
53%
Magnesium
366mg
160mg
49%
Vitamin B1
0.628mg
0.048mg
48%
Potassium
1788mg
609mg
35%
Copper
0.867mg
0.555mg
35%
Monounsaturated fat
14.04g
0.081g
35%
Fats
22.27g
1.68g
32%
Zinc
4.8mg
1.81mg
27%
Protein
17.81g
5.56g
25%
Vitamin E
3.33mg
22%
Vitamin A
64µg
238µg
19%
Polyunsaturated fat
3.279g
0.532g
18%
Vitamin B3
4.579mg
1.824mg
17%
Calories
375kcal
101kcal
14%
Fiber
10.5g
14g
14%
Vitamin B2
0.327mg
0.471mg
11%
Selenium
5.2µg
9%
Folate
10µg
45µg
9%
Vitamin B5
0.409mg
8%
Carbs
44.24g
24.45g
7%
Sodium
168mg
9mg
7%
Vitamin B6
0.435mg
0.348mg
7%
Vitamin K
5.4µg
5%
Saturated fat
1.535g
0.467g
5%
Choline
24.7mg
4%
Protein per 100 calories
4.7g
5.5g
N/A
Calories per 10 g protein
211kcal
182kcal
N/A
Weight per 100 calories
27g
99g
N/A
Unsaturated / Saturated Fat ratio
11
1.3
N/A
Net carbs
33.74g
10.45g
N/A
Sugar
2.25g
N/A
Tryptophan
0.114mg
0%
Threonine
0.154mg
0%
Isoleucine
0.285mg
0%
Leucine
0.262mg
0%
Lysine
0.126mg
0%
Valine
0.307mg
0%
Macronutrient Comparison
Macronutrient breakdown side-by-side comparison
4
18%
22%
44%
8%
8%
Protein:
17.81 g
Fats:
22.27 g
Carbs:
44.24 g
Water:
8.06 g
Other:
7.62 g
1
6%
2%
24%
65%
3%
Protein:
5.56 g
Fats:
1.68 g
Carbs:
24.45 g
Water:
65.11 g
Other:
3.2 g
Contains
more
Protein Protein
+220.3%
Contains
more
Fats Fats
+1225.6%
Contains
more
Carbs Carbs
+80.9%
Contains
more
Other Other
+138.1%
Contains
more
Water Water
+707.8%
Fat Type Comparison
Fat type breakdown side-by-side comparison
2
8%
74%
17%
Saturated fat:
Sat. Fat
1.535 g
Monounsaturated fat:
Mono. Fat
14.04 g
Polyunsaturated fat:
Poly. Fat
3.279 g
1
43%
8%
49%
Saturated fat:
Sat. Fat
0.467 g
Monounsaturated fat:
Mono. Fat
0.081 g
Polyunsaturated fat:
Poly. Fat
0.532 g
Contains
more
Mono. Fat Monounsaturated fat
+17233.3%
Contains
more
Poly. Fat Polyunsaturated fat
+516.4%
Contains
less
Sat. Fat Saturated fat
-69.6%