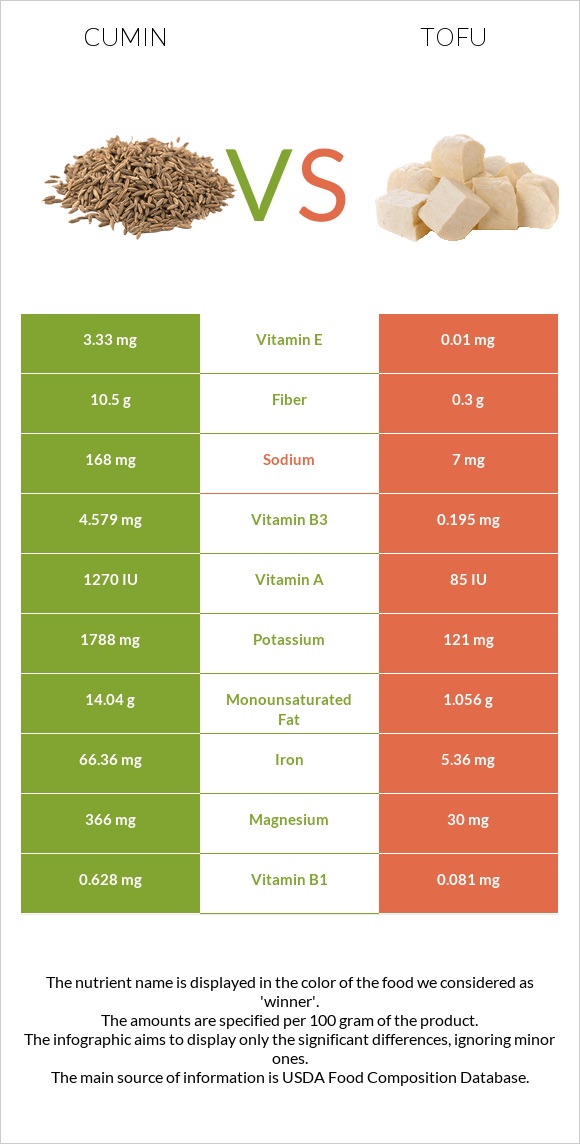
Significant differences between cumin and tofu The amount of iron, manganese, magnesium, copper, potassium, phosphorus, vitamin B1, fiber, zinc, and vitamin B6 in cumin is higher than in tofu. Cumin covers your daily iron needs 796% more than tofu. Tofu has 8 times less potassium than cumin. Cumin has 1788mg of potassium, while tofu has 237mg. Tofu has a higher glycemic index. The glycemic index of tofu is 15, while the glycemic index of cumin is 0. Specific food types used in this comparison are Spices, cumin seed and Tofu, raw, firm, prepared with calcium sulfate .
Infographic
Mineral Comparison
Mineral comparison score is based on the number of minerals by which one or the other food is richer. The "coverage" charts below show how much of the daily needs can be covered by 300 grams of the food.
8
100 g
300 g
0.25 tsp, whole - 0.5g 1 tbsp, whole - 6g
Magnesium
Magnesium
Calcium
Calcium
Potassium
Potassium
Iron
Iron
Copper
Copper
Zinc
Zinc
Phosphorus
Phosphorus
Sodium
Sodium
Manganese
Manganese
Selenium
Selenium
261%
279%
158%
2489%
289%
131%
214%
22%
435%
28%
2
100 g
300 g
0.25 block - 81g 0.5 cup - 126g
Magnesium
Magnesium
Calcium
Calcium
Potassium
Potassium
Iron
Iron
Copper
Copper
Zinc
Zinc
Phosphorus
Phosphorus
Sodium
Sodium
Manganese
Manganese
Selenium
Selenium
41%
205%
21%
100%
126%
43%
81%
1.8%
154%
95%
Vitamin Comparison
Vitamin comparison score is based on the number of vitamins by which one or the other food is richer. The "coverage" charts below show how much of the daily needs can be covered by 300 grams of the food.
8
100 g
300 g
0.25 tsp, whole - 0.5g 1 tbsp, whole - 6g
Vitamin C
Vit. C
Vitamin D
Vit. D
Vitamin A
Vit. A
Vitamin E
Vit. E
Vitamin B1
Vit. B1
Vitamin B2
Vit. B2
Vitamin B3
Vit. B3
Vitamin B5
Vit. B5
Vitamin B6
Vit. B6
Vitamin B12
Vit. B12
Vitamin K
Vit. K
Folate
Folate
26%
0%
21%
67%
157%
75%
86%
0%
100%
0%
14%
7.5%
2
100 g
300 g
0.25 block - 81g 0.5 cup - 126g
Vitamin C
Vit. C
Vitamin D
Vit. D
Vitamin A
Vit. A
Vitamin E
Vit. E
Vitamin B1
Vit. B1
Vitamin B2
Vit. B2
Vitamin B3
Vit. B3
Vitamin B5
Vit. B5
Vitamin B6
Vit. B6
Vitamin B12
Vit. B12
Vitamin K
Vit. K
Folate
Folate
0.67%
0%
0%
0%
40%
24%
7.1%
8%
21%
0%
0%
22%
All nutrients comparison - raw data values
Nutrient
DV% diff.
Iron
66.36mg
2.66mg
796%
Manganese
3.333mg
1.181mg
94%
Magnesium
366mg
58mg
73%
Copper
0.867mg
0.378mg
54%
Potassium
1788mg
237mg
46%
Phosphorus
499mg
190mg
44%
Vitamin B1
0.628mg
0.158mg
39%
Fiber
10.5g
2.3g
33%
Monounsaturated fat
14.04g
1.925g
30%
Zinc
4.8mg
1.57mg
29%
Vitamin B3
4.579mg
0.381mg
26%
Vitamin B6
0.435mg
0.092mg
26%
Calcium
931mg
683mg
25%
Vitamin E
3.33mg
22%
Selenium
5.2µg
17.4µg
22%
Fats
22.27g
8.72g
21%
Vitamin B2
0.327mg
0.102mg
17%
Carbs
44.24g
2.78g
14%
Calories
375kcal
144kcal
12%
Polyunsaturated fat
3.279g
4.921g
11%
Vitamin C
7.7mg
0.2mg
8%
Sodium
168mg
14mg
7%
Vitamin A
64µg
7%
Vitamin K
5.4µg
5%
Folate
10µg
29µg
5%
Choline
24.7mg
4%
Vitamin B5
0.133mg
3%
Protein
17.81g
17.27g
1%
Saturated fat
1.535g
1.261g
1%
Protein per 100 calories
4.7g
12g
N/A
Calories per 10 g protein
211kcal
83kcal
N/A
Weight per 100 calories
27g
69g
N/A
Unsaturated / Saturated Fat ratio
11
5.4
N/A
Net carbs
33.74g
0.48g
N/A
Sugar
2.25g
N/A
Tryptophan
0.235mg
0%
Threonine
0.785mg
0%
Isoleucine
0.849mg
0%
Leucine
1.392mg
0%
Lysine
0.883mg
0%
Methionine
0.211mg
0%
Phenylalanine
0.835mg
0%
Valine
0.87mg
0%
Histidine
0.431mg
0%
Macronutrient Comparison
Macronutrient breakdown side-by-side comparison
4
18%
22%
44%
8%
8%
Protein:
17.81 g
Fats:
22.27 g
Carbs:
44.24 g
Water:
8.06 g
Other:
7.62 g
1
17%
9%
3%
70%
Protein:
17.27 g
Fats:
8.72 g
Carbs:
2.78 g
Water:
69.83 g
Other:
1.4 g
Contains
more
Fats Fats
+155.4%
Contains
more
Carbs Carbs
+1491.4%
Contains
more
Other Other
+444.3%
Contains
more
Water Water
+766.4%
~equal in
Protein
~17.27g
Fat Type Comparison
Fat type breakdown side-by-side comparison
1
8%
74%
17%
Saturated fat:
Sat. Fat
1.535 g
Monounsaturated fat:
Mono. Fat
14.04 g
Polyunsaturated fat:
Poly. Fat
3.279 g
2
16%
24%
61%
Saturated fat:
Sat. Fat
1.261 g
Monounsaturated fat:
Mono. Fat
1.925 g
Polyunsaturated fat:
Poly. Fat
4.921 g
Contains
more
Mono. Fat Monounsaturated fat
+629.4%
Contains
less
Sat. Fat Saturated fat
-17.9%
Contains
more
Poly. Fat Polyunsaturated fat
+50.1%