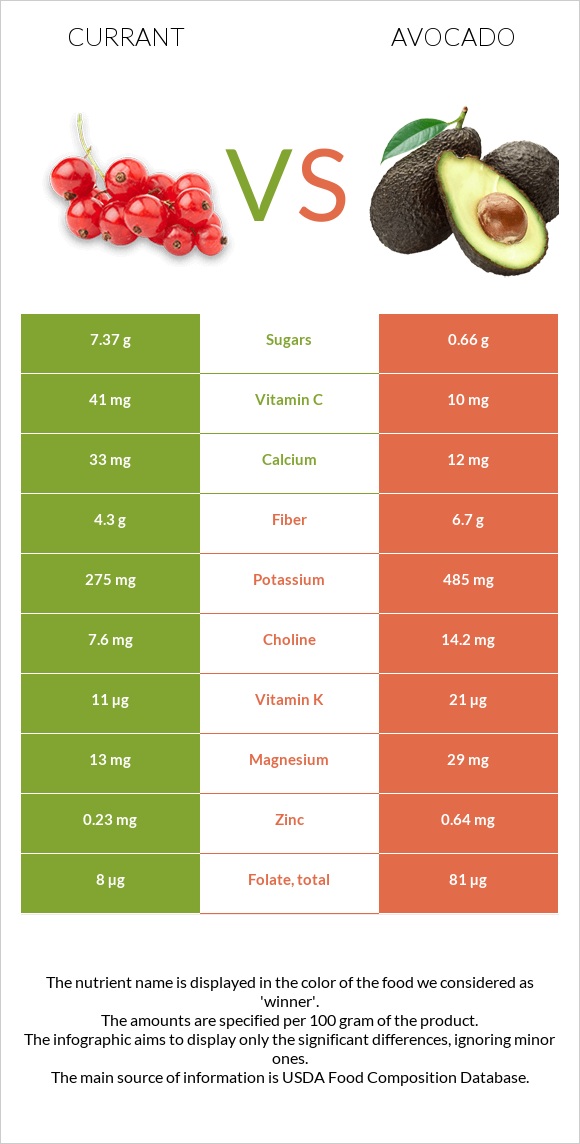
Differences between currants and avocados Currants have more vitamin C, while avocados have more vitamin B5, folate, vitamin B6, vitamin E, vitamin B3, fiber, copper, and vitamin K. Currants' daily need coverage for vitamin C is 34% higher. The amount of saturated fat in currants is lower. Currants have a lower glycemic index. The glycemic index of currants is 25, while the glycemic index of avocados is 40. The food types used in this comparison are Currants, red, and white, raw and Avocados, raw, all commercial varieties .
Infographic
Mineral Comparison
Mineral comparison score is based on the number of minerals by which one or the other food is richer. The "coverage" charts below show how much of the daily needs can be covered by 300 grams of the food.
5
100 g
300 g
1 cup - 112g
Magnesium
Magnesium
Calcium
Calcium
Potassium
Potassium
Iron
Iron
Copper
Copper
Zinc
Zinc
Phosphorus
Phosphorus
Sodium
Sodium
Manganese
Manganese
Selenium
Selenium
9.3%
9.9%
24%
38%
36%
6.3%
19%
0.13%
24%
3.3%
5
100 g
300 g
1 cup, sliced - 146g 1 cup, cubes - 150g 1 avocado, NS as to Florida or California - 201g 1 cup, pureed - 230g
Magnesium
Magnesium
Calcium
Calcium
Potassium
Potassium
Iron
Iron
Copper
Copper
Zinc
Zinc
Phosphorus
Phosphorus
Sodium
Sodium
Manganese
Manganese
Selenium
Selenium
21%
3.6%
43%
21%
63%
17%
22%
0.91%
19%
2.2%
Vitamin Comparison
Vitamin comparison score is based on the number of vitamins by which one or the other food is richer. The "coverage" charts below show how much of the daily needs can be covered by 300 grams of the food.
1
100 g
300 g
1 cup - 112g
Vitamin C
Vit. C
Vitamin D
Vit. D
Vitamin A
Vit. A
Vitamin E
Vit. E
Vitamin B1
Vit. B1
Vitamin B2
Vit. B2
Vitamin B3
Vit. B3
Vitamin B5
Vit. B5
Vitamin B6
Vit. B6
Vitamin B12
Vit. B12
Vitamin K
Vit. K
Folate
Folate
137%
0%
0.67%
2%
10%
12%
1.9%
3.8%
16%
0%
28%
6%
9
100 g
300 g
1 cup, sliced - 146g 1 cup, cubes - 150g 1 avocado, NS as to Florida or California - 201g 1 cup, pureed - 230g
Vitamin C
Vit. C
Vitamin D
Vit. D
Vitamin A
Vit. A
Vitamin E
Vit. E
Vitamin B1
Vit. B1
Vitamin B2
Vit. B2
Vitamin B3
Vit. B3
Vitamin B5
Vit. B5
Vitamin B6
Vit. B6
Vitamin B12
Vit. B12
Vitamin K
Vit. K
Folate
Folate
33%
0%
2.3%
41%
17%
30%
33%
83%
59%
0%
53%
61%
All nutrients comparison - raw data values
Nutrient
DV% diff.
Vitamin C
41mg
10mg
34%
Vitamin B5
0.064mg
1.389mg
27%
Monounsaturated fat
0.028g
9.799g
24%
Fats
0.2g
14.66g
22%
Folate
8µg
81µg
18%
Vitamin B6
0.07mg
0.257mg
14%
Vitamin E
0.1mg
2.07mg
13%
Polyunsaturated fat
0.088g
1.816g
12%
Fiber
4.3g
6.7g
10%
Vitamin B3
0.1mg
1.738mg
10%
Saturated fat
0.017g
2.126g
10%
Copper
0.107mg
0.19mg
9%
Vitamin K
11µg
21µg
8%
Potassium
275mg
485mg
6%
Iron
1mg
0.55mg
6%
Vitamin B2
0.05mg
0.13mg
6%
Calories
56kcal
160kcal
5%
Magnesium
13mg
29mg
4%
Zinc
0.23mg
0.64mg
4%
Fructose
3.53g
0.12g
4%
Carbs
13.8g
8.53g
2%
Calcium
33mg
12mg
2%
Manganese
0.186mg
0.142mg
2%
Vitamin B1
0.04mg
0.067mg
2%
Protein
1.4g
2g
1%
Phosphorus
44mg
52mg
1%
Vitamin A
2µg
7µg
1%
Choline
7.6mg
14.2mg
1%
Protein per 100 calories
2.5g
1.3g
N/A
Calories per 10 g protein
400kcal
800kcal
N/A
Weight per 100 calories
179g
63g
N/A
Unsaturated / Saturated Fat ratio
6.8
5.5
N/A
Net carbs
9.5g
1.83g
N/A
Sugar
7.37g
0.66g
N/A
Starch
0.11g
0%
Sodium
1mg
7mg
0%
Selenium
0.6µg
0.4µg
0%
Tryptophan
0.025mg
0%
Threonine
0.073mg
0%
Isoleucine
0.084mg
0%
Leucine
0.143mg
0%
Lysine
0.132mg
0%
Methionine
0.038mg
0%
Phenylalanine
0.097mg
0%
Valine
0.107mg
0%
Histidine
0.049mg
0%
Omega-3 - ALA
0.111g
N/A
Omega-6 - Gamma-linoleic acid
0.015g
N/A
Macronutrient Comparison
Macronutrient breakdown side-by-side comparison
2
14%
84%
Protein:
1.4 g
Fats:
0.2 g
Carbs:
13.8 g
Water:
83.95 g
Other:
0.65 g
3
2%
15%
9%
73%
Protein:
2 g
Fats:
14.66 g
Carbs:
8.53 g
Water:
73.23 g
Other:
1.58 g
Contains
more
Carbs Carbs
+61.8%
Contains
more
Water Water
+14.6%
Contains
more
Protein Protein
+42.9%
Contains
more
Fats Fats
+7230%
Contains
more
Other Other
+143.1%
Fat Type Comparison
Fat type breakdown side-by-side comparison
1
13%
21%
66%
Saturated fat:
Sat. Fat
0.017 g
Monounsaturated fat:
Mono. Fat
0.028 g
Polyunsaturated fat:
Poly. Fat
0.088 g
2
15%
71%
13%
Saturated fat:
Sat. Fat
2.126 g
Monounsaturated fat:
Mono. Fat
9.799 g
Polyunsaturated fat:
Poly. Fat
1.816 g
Contains
less
Sat. Fat Saturated fat
-99.2%
Contains
more
Mono. Fat Monounsaturated fat
+34896.4%
Contains
more
Poly. Fat Polyunsaturated fat
+1963.6%
Carbohydrate type comparison
Carbohydrate type breakdown side-by-side comparison
3
8%
44%
48%
Starch:
0 g
Sucrose:
0.61 g
Glucose:
3.22 g
Fructose:
3.53 g
Lactose:
0 g
Maltose:
0 g
Galactose:
0 g
2
14%
8%
49%
16%
13%
Starch:
0.11 g
Sucrose:
0.06 g
Glucose:
0.37 g
Fructose:
0.12 g
Lactose:
0 g
Maltose:
0 g
Galactose:
0.1 g
Contains
more
Sucrose Sucrose
+916.7%
Contains
more
Glucose Glucose
+770.3%
Contains
more
Fructose Fructose
+2841.7%
Contains
more
Starch Starch
+∞%
Contains
more
Galactose Galactose
+∞%
~equal in
Lactose
~0g
~equal in
Maltose
~0g