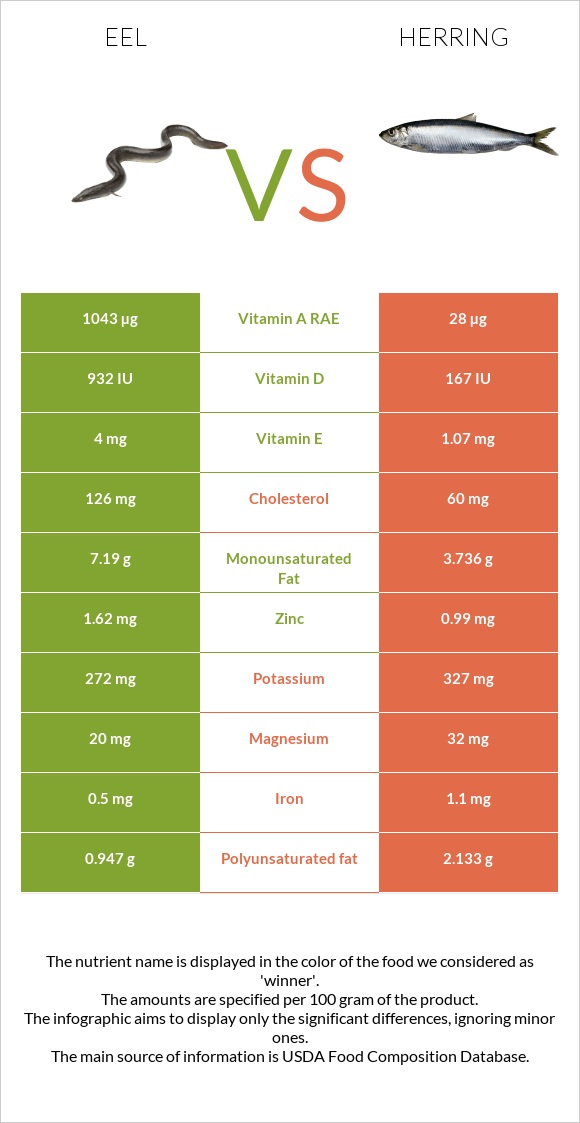
A recap on the differences between eels and herring Eels are higher in vitamin A, zinc, vitamin B3, and vitamin B1, yet herring is higher in vitamin B12, selenium, vitamin B6, vitamin B2, and vitamin B5. Herring covers your daily vitamin B12 needs 449% more than eels. Eels contain 41 times more vitamin A than herring. While eels contain 3787 IU of vitamin A, herring contains only 93 IU. The amount of cholesterol in herring is lower. Food varieties used in this article are Fish, eel, mixed species, cooked, dry heat and Fish, herring, Atlantic, raw .
Infographic
Mineral Comparison
Mineral comparison score is based on the number of minerals by which one or the other food is richer. The "coverage" charts below show how much of the daily needs can be covered by 300 grams of the food.
4
100 g
300 g
1 cubic inch, boneless - 17g 1 oz with bone (yield after bone removed) - 22g 1 oz, boneless - 28.35g 3 oz - 85g 1 fillet - 159g
Magnesium
Magnesium
Calcium
Calcium
Potassium
Potassium
Iron
Iron
Copper
Copper
Zinc
Zinc
Phosphorus
Phosphorus
Sodium
Sodium
Manganese
Manganese
Selenium
Selenium
19%
7.8%
31%
24%
9.7%
57%
119%
8.5%
5.2%
45%
5
100 g
300 g
1 oz, boneless - 28.35g 3 oz - 85g 1 fillet - 184g
Magnesium
Magnesium
Calcium
Calcium
Potassium
Potassium
Iron
Iron
Copper
Copper
Zinc
Zinc
Phosphorus
Phosphorus
Sodium
Sodium
Manganese
Manganese
Selenium
Selenium
23%
17%
29%
41%
31%
27%
101%
12%
4.6%
199%
Vitamin Comparison
Vitamin comparison score is based on the number of vitamins by which one or the other food is richer. The "coverage" charts below show how much of the daily needs can be covered by 300 grams of the food.
5
100 g
300 g
1 cubic inch, boneless - 17g 1 oz with bone (yield after bone removed) - 22g 1 oz, boneless - 28.35g 3 oz - 85g 1 fillet - 159g
Vitamin C
Vit. C
Vitamin D
Vit. D
Vitamin A
Vit. A
Vitamin E
Vit. E
Vitamin B1
Vit. B1
Vitamin B2
Vit. B2
Vitamin B3
Vit. B3
Vitamin B5
Vit. B5
Vitamin B6
Vit. B6
Vitamin B12
Vit. B12
Vitamin K
Vit. K
Folate
Folate
6%
0%
379%
0%
46%
12%
84%
17%
18%
361%
0%
13%
7
100 g
300 g
1 oz, boneless - 28.35g 3 oz - 85g 1 fillet - 184g
Vitamin C
Vit. C
Vitamin D
Vit. D
Vitamin A
Vit. A
Vitamin E
Vit. E
Vitamin B1
Vit. B1
Vitamin B2
Vit. B2
Vitamin B3
Vit. B3
Vitamin B5
Vit. B5
Vitamin B6
Vit. B6
Vitamin B12
Vit. B12
Vitamin K
Vit. K
Folate
Folate
2.3%
63%
9.3%
21%
23%
54%
60%
39%
70%
1709%
0.25%
7.5%
All nutrients comparison - raw data values
Nutrient
DV% diff.
Vitamin B12
2.89µg
13.67µg
449%
Vitamin A
1137µg
28µg
123%
Selenium
8.3µg
36.5µg
51%
Cholesterol
161mg
60mg
34%
Vitamin D*
167 IU
21%
Vitamin D
4.2µg
21%
Vitamin B6
0.077mg
0.302mg
17%
Vitamin B2
0.051mg
0.233mg
14%
Monounsaturated fat
9.218g
3.736g
14%
Choline
65mg
12%
Protein
23.65g
17.96g
11%
Zinc
2.08mg
0.99mg
10%
Fats
14.95g
9.04g
9%
Vitamin B1
0.183mg
0.092mg
8%
Vitamin B3
4.487mg
3.217mg
8%
Copper
0.029mg
0.092mg
7%
Vitamin E
1.07mg
7%
Vitamin B5
0.28mg
0.645mg
7%
Iron
0.64mg
1.1mg
6%
Phosphorus
277mg
236mg
6%
Polyunsaturated fat
1.214g
2.133g
6%
Calories
236kcal
158kcal
4%
Saturated fat
3.023g
2.04g
4%
Calcium
26mg
57mg
3%
Folate
17µg
10µg
2%
Vitamin C
1.8mg
0.7mg
1%
Magnesium
26mg
32mg
1%
Potassium
349mg
327mg
1%
Sodium
65mg
90mg
1%
Protein per 100 calories
10g
11g
N/A
Calories per 10 g protein
100kcal
88kcal
N/A
Weight per 100 calories
42g
63g
N/A
Unsaturated / Saturated Fat ratio
3.5
2.9
N/A
Manganese
0.04mg
0.035mg
0%
Vitamin K
0.1µg
0%
Tryptophan
0.265mg
0.201mg
0%
Threonine
1.037mg
0.787mg
0%
Isoleucine
1.09mg
0.828mg
0%
Leucine
1.922mg
1.46mg
0%
Lysine
2.171mg
1.65mg
0%
Methionine
0.7mg
0.532mg
0%
Phenylalanine
0.923mg
0.701mg
0%
Valine
1.218mg
0.925mg
0%
Histidine
0.696mg
0.529mg
0%
Omega-3 - EPA
0.108g
0.709g
N/A
Omega-3 - DHA
0.081g
0.862g
N/A
Omega-3 - DPA
0.095g
0.055g
N/A
Macronutrient Comparison
Macronutrient breakdown side-by-side comparison
3
24%
15%
59%
2%
Protein:
23.65 g
Fats:
14.95 g
Carbs:
0 g
Water:
59.31 g
Other:
2.09 g
1
18%
9%
72%
Protein:
17.96 g
Fats:
9.04 g
Carbs:
0 g
Water:
72.05 g
Other:
0.95 g
Contains
more
Protein Protein
+31.7%
Contains
more
Fats Fats
+65.4%
Contains
more
Other Other
+120%
Contains
more
Water Water
+21.5%
Fat Type Comparison
Fat type breakdown side-by-side comparison
1
22%
69%
9%
Saturated fat:
Sat. Fat
3.023 g
Monounsaturated fat:
Mono. Fat
9.218 g
Polyunsaturated fat:
Poly. Fat
1.214 g
2
26%
47%
27%
Saturated fat:
Sat. Fat
2.04 g
Monounsaturated fat:
Mono. Fat
3.736 g
Polyunsaturated fat:
Poly. Fat
2.133 g
Contains
more
Mono. Fat Monounsaturated fat
+146.7%
Contains
less
Sat. Fat Saturated fat
-32.5%
Contains
more
Poly. Fat Polyunsaturated fat
+75.7%