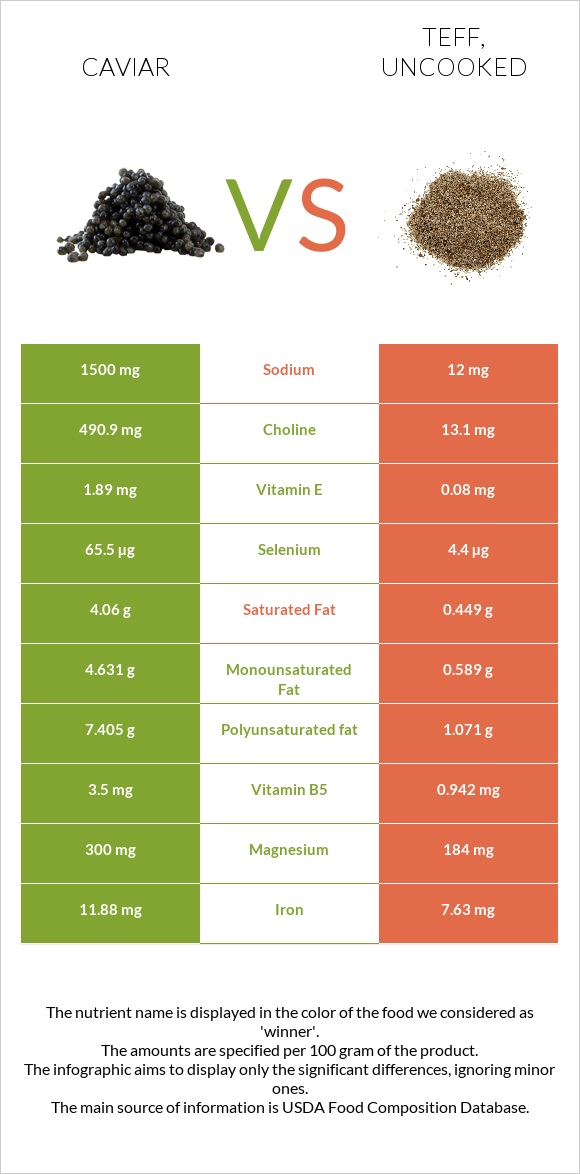
The main differences between caviar and teff Caviar has more selenium, choline, iron, vitamin B5, magnesium, and vitamin B2; however, teff has more manganese, copper, and fiber. Daily need coverage for manganese for teff is 400% higher. Teff has 125 times less sodium than caviar. Caviar has 1500mg of sodium, while teff has 12mg. Food types used in this article are Fish, caviar, black, and red, granular and Teff, uncooked .
Infographic
Mineral Comparison
Mineral comparison score is based on the number of minerals by which one or the other food is richer. The "coverage" charts below show how much of the daily needs can be covered by 300 grams of the food.
4
100 g
300 g
1 tbsp - 16g 1 oz - 28.35g
Magnesium
Magnesium
Calcium
Calcium
Potassium
Potassium
Iron
Iron
Copper
Copper
Zinc
Zinc
Phosphorus
Phosphorus
Sodium
Sodium
Manganese
Manganese
Selenium
Selenium
214%
83%
16%
446%
37%
26%
153%
196%
6.5%
357%
6
100 g
300 g
1 cup - 193g
Magnesium
Magnesium
Calcium
Calcium
Potassium
Potassium
Iron
Iron
Copper
Copper
Zinc
Zinc
Phosphorus
Phosphorus
Sodium
Sodium
Manganese
Manganese
Selenium
Selenium
131%
54%
38%
286%
270%
99%
184%
1.6%
1205%
24%
Vitamin Comparison
Vitamin comparison score is based on the number of vitamins by which one or the other food is richer. The "coverage" charts below show how much of the daily needs can be covered by 300 grams of the food.
7
100 g
300 g
1 tbsp - 16g 1 oz - 28.35g
Vitamin C
Vit. C
Vitamin D
Vit. D
Vitamin A
Vit. A
Vitamin E
Vit. E
Vitamin B1
Vit. B1
Vitamin B2
Vit. B2
Vitamin B3
Vit. B3
Vitamin B5
Vit. B5
Vitamin B6
Vit. B6
Vitamin B12
Vit. B12
Vitamin K
Vit. K
Folate
Folate
0%
44%
90%
38%
48%
143%
2.3%
210%
74%
2500%
1.5%
38%
4
100 g
300 g
1 cup - 193g
Vitamin C
Vit. C
Vitamin D
Vit. D
Vitamin A
Vit. A
Vitamin E
Vit. E
Vitamin B1
Vit. B1
Vitamin B2
Vit. B2
Vitamin B3
Vit. B3
Vitamin B5
Vit. B5
Vitamin B6
Vit. B6
Vitamin B12
Vit. B12
Vitamin K
Vit. K
Folate
Folate
0%
0%
0%
1.6%
98%
62%
63%
57%
111%
0%
4.8%
0%
All nutrients comparison - raw data values
Nutrient
DV% diff.
Vitamin B12
20µg
833%
Manganese
0.05mg
9.24mg
400%
Cholesterol
588mg
196%
Selenium
65.5µg
4.4µg
111%
Choline
490.9mg
13.1mg
87%
Copper
0.11mg
0.81mg
78%
Sodium
1500mg
12mg
65%
Iron
11.88mg
7.63mg
53%
Vitamin B5
3.5mg
0.942mg
51%
Polyunsaturated fat
7.405g
1.071g
42%
Fiber
0g
8g
32%
Vitamin A
271µg
0µg
30%
Magnesium
300mg
184mg
28%
Vitamin B2
0.62mg
0.27mg
27%
Fats
17.9g
2.38g
24%
Zinc
0.95mg
3.63mg
24%
Protein
24.6g
13.3g
23%
Carbs
4g
73.13g
23%
Vitamin B3
0.12mg
3.363mg
20%
Vitamin B1
0.19mg
0.39mg
17%
Saturated fat
4.06g
0.449g
16%
Vitamin D*
117 IU
15%
Vitamin D
2.9µg
15%
Starch
36.56g
15%
Folate
50µg
13%
Vitamin E
1.89mg
0.08mg
12%
Vitamin B6
0.32mg
0.482mg
12%
Calcium
275mg
180mg
10%
Phosphorus
356mg
429mg
10%
Monounsaturated fat
4.631g
0.589g
10%
Potassium
181mg
427mg
7%
Calories
264kcal
367kcal
5%
Vitamin K
0.6µg
1.9µg
1%
Fructose
0.47g
1%
Protein per 100 calories
9.3g
3.6g
N/A
Calories per 10 g protein
107kcal
276kcal
N/A
Weight per 100 calories
38g
27g
N/A
Unsaturated / Saturated Fat ratio
3
3.7
N/A
Net carbs
4g
65.13g
N/A
Sugar
0g
1.84g
N/A
Tryptophan
0.323mg
0.139mg
0%
Threonine
1.263mg
0.51mg
0%
Isoleucine
1.035mg
0.501mg
0%
Leucine
2.133mg
1.068mg
0%
Lysine
1.834mg
0.376mg
0%
Methionine
0.646mg
0.428mg
0%
Phenylalanine
1.071mg
0.698mg
0%
Valine
1.263mg
0.686mg
0%
Histidine
0.649mg
0.301mg
0%
Omega-3 - EPA
2.741g
N/A
Omega-3 - DHA
3.8g
N/A
Omega-3 - ALA
0.135g
N/A
Omega-3 - DPA
0.229g
N/A
Macronutrient Comparison
Macronutrient breakdown side-by-side comparison
4
25%
18%
4%
48%
6%
Protein:
24.6 g
Fats:
17.9 g
Carbs:
4 g
Water:
47.5 g
Other:
6 g
1
13%
2%
73%
9%
2%
Protein:
13.3 g
Fats:
2.38 g
Carbs:
73.13 g
Water:
8.82 g
Other:
2.37 g
Contains
more
Protein Protein
+85%
Contains
more
Fats Fats
+652.1%
Contains
more
Water Water
+438.5%
Contains
more
Other Other
+153.2%
Contains
more
Carbs Carbs
+1728.3%
Fat Type Comparison
Fat type breakdown side-by-side comparison
2
25%
29%
46%
Saturated fat:
Sat. Fat
4.06 g
Monounsaturated fat:
Mono. Fat
4.631 g
Polyunsaturated fat:
Poly. Fat
7.405 g
1
21%
28%
51%
Saturated fat:
Sat. Fat
0.449 g
Monounsaturated fat:
Mono. Fat
0.589 g
Polyunsaturated fat:
Poly. Fat
1.071 g
Contains
more
Mono. Fat Monounsaturated fat
+686.2%
Contains
more
Poly. Fat Polyunsaturated fat
+591.4%
Contains
less
Sat. Fat Saturated fat
-88.9%