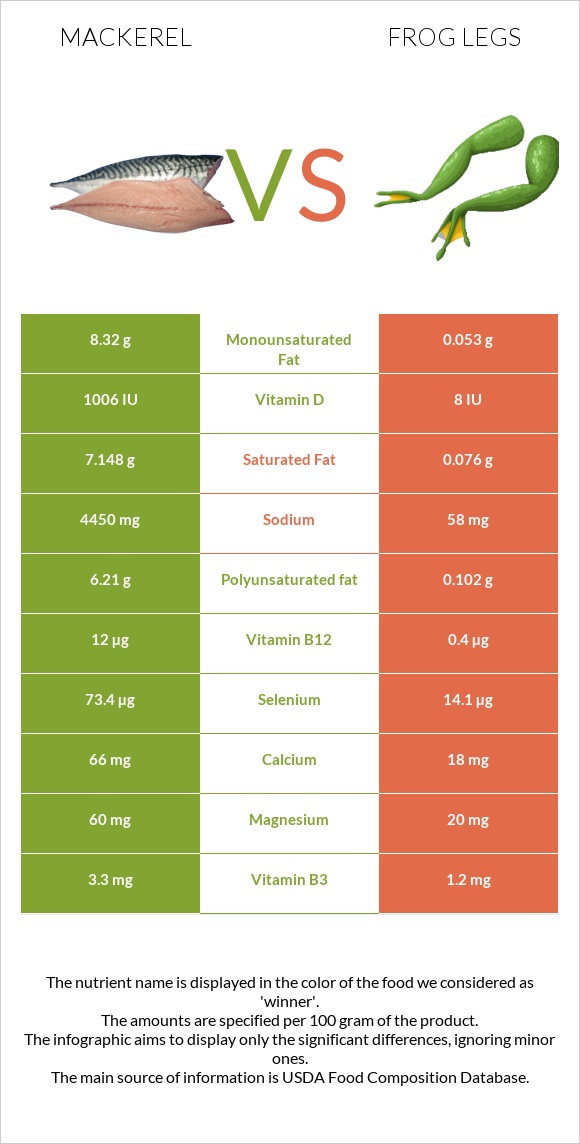
Significant differences between mackerel and frog legs Mackerel is richer in vitamin B12, vitamin D*, selenium, vitamin B6, phosphorus, and vitamin B3, while frog legs are higher in copper. Mackerel covers your daily vitamin B12 needs 483% more than frog legs. Mackerel has 126 times more vitamin D* than frog legs. Mackerel has 1006 IU of vitamin D*, while frog legs have 8 IU. Frog legs are lower in saturated fat. Specific food types used in this comparison are Fish, mackerel, salted and Frog legs, raw .
Infographic
Mineral Comparison
Mineral comparison score is based on the number of minerals by which one or the other food is richer. The "coverage" charts below show how much of the daily needs can be covered by 300 grams of the food.
5
100 g
300 g
1 cubic inch, boneless - 17g 1 piece (5-1/2" x 1-1/2" x 1/2") - 80g 1 cup, cooked - 136g
Magnesium
Magnesium
Calcium
Calcium
Potassium
Potassium
Iron
Iron
Copper
Copper
Zinc
Zinc
Phosphorus
Phosphorus
Sodium
Sodium
Manganese
Manganese
Selenium
Selenium
43%
20%
46%
53%
33%
30%
109%
580%
0%
400%
2
100 g
300 g
1 leg - 45g
Magnesium
Magnesium
Calcium
Calcium
Potassium
Potassium
Iron
Iron
Copper
Copper
Zinc
Zinc
Phosphorus
Phosphorus
Sodium
Sodium
Manganese
Manganese
Selenium
Selenium
14%
5.4%
25%
56%
83%
27%
63%
7.6%
0%
77%
Vitamin Comparison
Vitamin comparison score is based on the number of vitamins by which one or the other food is richer. The "coverage" charts below show how much of the daily needs can be covered by 300 grams of the food.
7
100 g
300 g
1 cubic inch, boneless - 17g 1 piece (5-1/2" x 1-1/2" x 1/2") - 80g 1 cup, cooked - 136g
Vitamin C
Vit. C
Vitamin D
Vit. D
Vitamin A
Vit. A
Vitamin E
Vit. E
Vitamin B1
Vit. B1
Vitamin B2
Vit. B2
Vitamin B3
Vit. B3
Vitamin B5
Vit. B5
Vitamin B6
Vit. B6
Vitamin B12
Vit. B12
Vitamin K
Vit. K
Folate
Folate
0%
378%
16%
48%
5%
44%
62%
0%
95%
1500%
20%
11%
2
100 g
300 g
1 leg - 45g
Vitamin C
Vit. C
Vitamin D
Vit. D
Vitamin A
Vit. A
Vitamin E
Vit. E
Vitamin B1
Vit. B1
Vitamin B2
Vit. B2
Vitamin B3
Vit. B3
Vitamin B5
Vit. B5
Vitamin B6
Vit. B6
Vitamin B12
Vit. B12
Vitamin K
Vit. K
Folate
Folate
0%
3%
5%
20%
35%
58%
23%
0%
28%
50%
0.25%
11%
All nutrients comparison - raw data values
Nutrient
DV% diff.
Vitamin B12
12µg
0.4µg
483%
Sodium
4450mg
58mg
191%
Vitamin D*
1006 IU
8 IU
125%
Vitamin D
25.2µg
0.2µg
125%
Selenium
73.4µg
14.1µg
108%
Polyunsaturated fat
6.21g
0.102g
41%
Fats
25.1g
0.3g
38%
Saturated fat
7.148g
0.076g
32%
Vitamin B6
0.41mg
0.12mg
22%
Monounsaturated fat
8.32g
0.053g
21%
Copper
0.1mg
0.25mg
17%
Cholesterol
95mg
50mg
15%
Phosphorus
254mg
147mg
15%
Vitamin B3
3.3mg
1.2mg
13%
Calories
305kcal
73kcal
12%
Magnesium
60mg
20mg
10%
Vitamin B1
0.02mg
0.14mg
10%
Vitamin E
2.38mg
1mg
9%
Potassium
520mg
285mg
7%
Choline
101.6mg
65mg
7%
Vitamin K
7.8µg
0.1µg
6%
Calcium
66mg
18mg
5%
Vitamin B2
0.19mg
0.25mg
5%
Protein
18.5g
16.4g
4%
Vitamin A
47µg
15µg
4%
Iron
1.4mg
1.5mg
1%
Zinc
1.1mg
1mg
1%
Protein per 100 calories
6.1g
22g
N/A
Calories per 10 g protein
165kcal
45kcal
N/A
Weight per 100 calories
33g
137g
N/A
Unsaturated / Saturated Fat ratio
2
2
N/A
Folate
15µg
15µg
0%
Omega-3 - EPA
1.619g
0.014g
N/A
Omega-3 - DHA
2.965g
0.02g
N/A
Omega-3 - DPA
0.391g
0.007g
N/A
Macronutrient Comparison
Macronutrient breakdown side-by-side comparison
3
19%
25%
43%
13%
Protein:
18.5 g
Fats:
25.1 g
Carbs:
0 g
Water:
43 g
Other:
13.4 g
1
16%
82%
Protein:
16.4 g
Fats:
0.3 g
Carbs:
0 g
Water:
81.9 g
Other:
1.4 g
Contains
more
Protein Protein
+12.8%
Contains
more
Fats Fats
+8266.7%
Contains
more
Other Other
+857.1%
Contains
more
Water Water
+90.5%
Fat Type Comparison
Fat type breakdown side-by-side comparison
2
33%
38%
29%
Saturated fat:
Sat. Fat
7.148 g
Monounsaturated fat:
Mono. Fat
8.32 g
Polyunsaturated fat:
Poly. Fat
6.21 g
1
33%
23%
44%
Saturated fat:
Sat. Fat
0.076 g
Monounsaturated fat:
Mono. Fat
0.053 g
Polyunsaturated fat:
Poly. Fat
0.102 g
Contains
more
Mono. Fat Monounsaturated fat
+15598.1%
Contains
more
Poly. Fat Polyunsaturated fat
+5988.2%
Contains
less
Sat. Fat Saturated fat
-98.9%