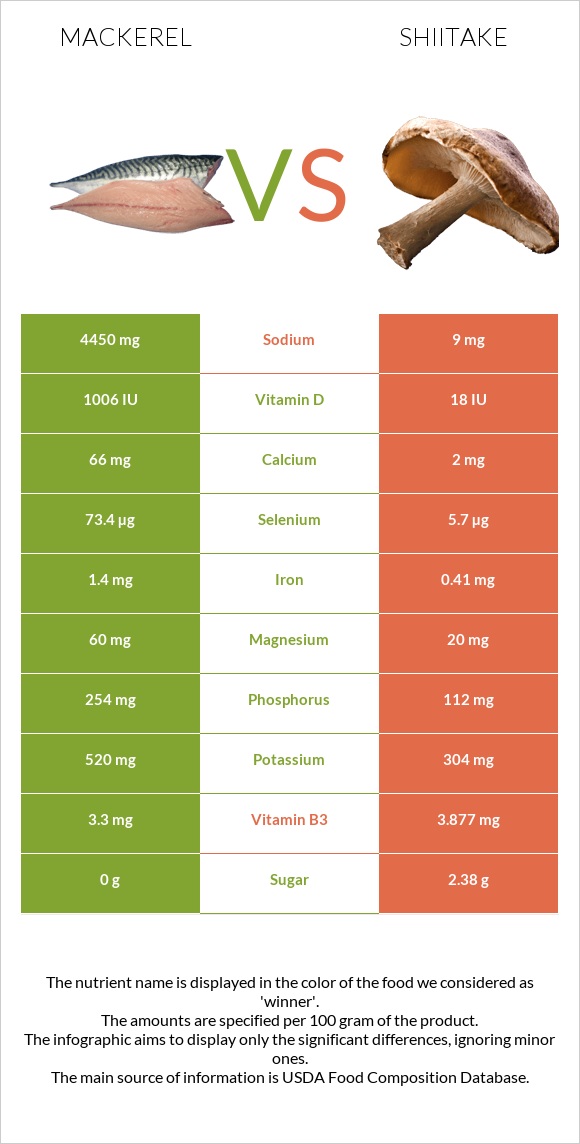
How are mackerel and shiitake different? Mackerel is richer in vitamin D*, selenium, phosphorus, iron, magnesium, vitamin B6, calcium, and potassium, while shiitake is higher in fiber. Mackerel covers your daily need for sodium, 193% more than shiitake. Mackerel contains 56 times more vitamin D* than shiitake. Mackerel contains 1006 IU of vitamin D*, while shiitake contains 18 IU. Shiitake is lower in sodium. Shiitake has a higher glycemic index (32) than mackerel (0). Fish, mackerel, salted and Mushrooms, shiitake, raw types were used in this article.
Infographic
Mineral Comparison
Mineral comparison score is based on the number of minerals by which one or the other food is richer. The "coverage" charts below show how much of the daily needs can be covered by 300 grams of the food.
6
100 g
300 g
1 cubic inch, boneless - 17g 1 piece (5-1/2" x 1-1/2" x 1/2") - 80g 1 cup, cooked - 136g
Magnesium
Magnesium
Calcium
Calcium
Potassium
Potassium
Iron
Iron
Copper
Copper
Zinc
Zinc
Phosphorus
Phosphorus
Sodium
Sodium
Manganese
Manganese
Selenium
Selenium
43%
20%
46%
53%
33%
30%
109%
580%
0%
400%
3
100 g
300 g
1 piece whole - 19g
Magnesium
Magnesium
Calcium
Calcium
Potassium
Potassium
Iron
Iron
Copper
Copper
Zinc
Zinc
Phosphorus
Phosphorus
Sodium
Sodium
Manganese
Manganese
Selenium
Selenium
14%
0.6%
27%
15%
47%
28%
48%
1.2%
30%
31%
Vitamin Comparison
Vitamin comparison score is based on the number of vitamins by which one or the other food is richer. The "coverage" charts below show how much of the daily needs can be covered by 300 grams of the food.
8
100 g
300 g
1 cubic inch, boneless - 17g 1 piece (5-1/2" x 1-1/2" x 1/2") - 80g 1 cup, cooked - 136g
Vitamin C
Vit. C
Vitamin D
Vit. D
Vitamin A
Vit. A
Vitamin E
Vit. E
Vitamin B1
Vit. B1
Vitamin B2
Vit. B2
Vitamin B3
Vit. B3
Vitamin B5
Vit. B5
Vitamin B6
Vit. B6
Vitamin B12
Vit. B12
Vitamin K
Vit. K
Folate
Folate
0%
378%
16%
48%
5%
44%
62%
0%
95%
1500%
20%
11%
3
100 g
300 g
1 piece whole - 19g
Vitamin C
Vit. C
Vitamin D
Vit. D
Vitamin A
Vit. A
Vitamin E
Vit. E
Vitamin B1
Vit. B1
Vitamin B2
Vit. B2
Vitamin B3
Vit. B3
Vitamin B5
Vit. B5
Vitamin B6
Vit. B6
Vitamin B12
Vit. B12
Vitamin K
Vit. K
Folate
Folate
0%
6%
0%
0%
3.8%
50%
73%
90%
68%
0%
0%
9.8%
All nutrients comparison - raw data values
Nutrient
DV% diff.
Vitamin B12
12µg
500%
Sodium
4450mg
9mg
193%
Vitamin D*
1006 IU
18 IU
124%
Vitamin D
25.2µg
0.4µg
124%
Selenium
73.4µg
5.7µg
123%
Polyunsaturated fat
6.21g
41%
Fats
25.1g
0.49g
38%
Protein
18.5g
2.24g
33%
Cholesterol
95mg
32%
Saturated fat
7.148g
32%
Vitamin B5
1.5mg
30%
Monounsaturated fat
8.32g
21%
Phosphorus
254mg
112mg
20%
Choline
101.6mg
18%
Vitamin E
2.38mg
16%
Calories
305kcal
34kcal
14%
Iron
1.4mg
0.41mg
12%
Magnesium
60mg
20mg
10%
Fiber
0g
2.5g
10%
Manganese
0.23mg
10%
Vitamin B6
0.41mg
0.293mg
9%
Vitamin K
7.8µg
7%
Calcium
66mg
2mg
6%
Potassium
520mg
304mg
6%
Copper
0.1mg
0.142mg
5%
Vitamin A
47µg
5%
Vitamin B3
3.3mg
3.877mg
4%
Carbs
0g
6.79g
2%
Vitamin B2
0.19mg
0.217mg
2%
Zinc
1.1mg
1.03mg
1%
Folate
15µg
13µg
1%
Protein per 100 calories
6.1g
6.6g
N/A
Calories per 10 g protein
165kcal
152kcal
N/A
Weight per 100 calories
33g
294g
N/A
Unsaturated / Saturated Fat ratio
2
N/A
Net carbs
0g
4.29g
N/A
Sugar
0g
2.38g
N/A
Vitamin B1
0.02mg
0.015mg
0%
Tryptophan
0.011mg
0%
Threonine
0.134mg
0%
Isoleucine
0.111mg
0%
Leucine
0.189mg
0%
Lysine
0.134mg
0%
Methionine
0.033mg
0%
Phenylalanine
0.111mg
0%
Valine
0.145mg
0%
Histidine
0.056mg
0%
Omega-3 - EPA
1.619g
N/A
Omega-3 - DHA
2.965g
N/A
Omega-3 - DPA
0.391g
N/A
Macronutrient Comparison
Macronutrient breakdown side-by-side comparison
3
19%
25%
43%
13%
Protein:
18.5 g
Fats:
25.1 g
Carbs:
0 g
Water:
43 g
Other:
13.4 g
2
2%
7%
90%
Protein:
2.24 g
Fats:
0.49 g
Carbs:
6.79 g
Water:
89.74 g
Other:
0.74 g
Contains
more
Protein Protein
+725.9%
Contains
more
Fats Fats
+5022.4%
Contains
more
Other Other
+1710.8%
Contains
more
Carbs Carbs
+∞%
Contains
more
Water Water
+108.7%