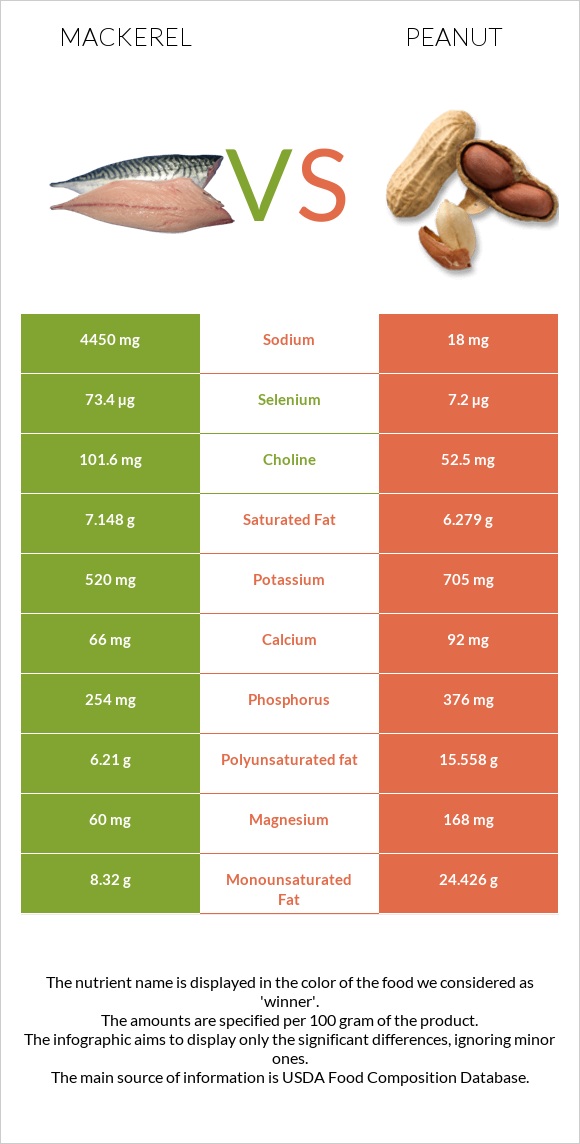
What are the differences between mackerel and peanuts? Mackerel is higher in vitamin B12, vitamin D* and selenium, yet peanuts are higher in copper, folate, vitamin B3, vitamin B1, iron, and vitamin E. Mackerel's daily need coverage for vitamin B12 is 500% more. The amount of sodium in peanuts is lower. The glycemic index of mackerel is lower. We used Fish, mackerel, salted and Peanuts, all types, raw types in this article.
Infographic
Mineral Comparison
Mineral comparison score is based on the number of minerals by which one or the other food is richer. The "coverage" charts below show how much of the daily needs can be covered by 300 grams of the food.
1
100 g
300 g
1 cubic inch, boneless - 17g 1 piece (5-1/2" x 1-1/2" x 1/2") - 80g 1 cup, cooked - 136g
Magnesium
Magnesium
Calcium
Calcium
Potassium
Potassium
Iron
Iron
Copper
Copper
Zinc
Zinc
Phosphorus
Phosphorus
Sodium
Sodium
Manganese
Manganese
Selenium
Selenium
43%
20%
46%
53%
33%
30%
109%
580%
0%
400%
9
100 g
300 g
1 oz - 28.35g 1 cup - 146g
Magnesium
Magnesium
Calcium
Calcium
Potassium
Potassium
Iron
Iron
Copper
Copper
Zinc
Zinc
Phosphorus
Phosphorus
Sodium
Sodium
Manganese
Manganese
Selenium
Selenium
120%
28%
62%
172%
381%
89%
161%
2.3%
252%
39%
Vitamin Comparison
Vitamin comparison score is based on the number of vitamins by which one or the other food is richer. The "coverage" charts below show how much of the daily needs can be covered by 300 grams of the food.
6
100 g
300 g
1 cubic inch, boneless - 17g 1 piece (5-1/2" x 1-1/2" x 1/2") - 80g 1 cup, cooked - 136g
Vitamin C
Vit. C
Vitamin D
Vit. D
Vitamin A
Vit. A
Vitamin E
Vit. E
Vitamin B1
Vit. B1
Vitamin B2
Vit. B2
Vitamin B3
Vit. B3
Vitamin B5
Vit. B5
Vitamin B6
Vit. B6
Vitamin B12
Vit. B12
Vitamin K
Vit. K
Folate
Folate
0%
378%
16%
48%
5%
44%
62%
0%
95%
1500%
20%
11%
5
100 g
300 g
1 oz - 28.35g 1 cup - 146g
Vitamin C
Vit. C
Vitamin D
Vit. D
Vitamin A
Vit. A
Vitamin E
Vit. E
Vitamin B1
Vit. B1
Vitamin B2
Vit. B2
Vitamin B3
Vit. B3
Vitamin B5
Vit. B5
Vitamin B6
Vit. B6
Vitamin B12
Vit. B12
Vitamin K
Vit. K
Folate
Folate
0%
0%
0%
167%
160%
31%
226%
106%
80%
0%
0%
180%
All nutrients comparison - raw data values
Nutrient
DV% diff.
Vitamin B12
12µg
0µg
500%
Sodium
4450mg
18mg
193%
Vitamin D*
1006 IU
0 IU
126%
Vitamin D
25.2µg
0µg
126%
Selenium
73.4µg
7.2µg
120%
Copper
0.1mg
1.144mg
116%
Manganese
1.934mg
84%
Polyunsaturated fat
6.21g
15.558g
62%
Folate
15µg
240µg
56%
Vitamin B3
3.3mg
12.066mg
55%
Vitamin B1
0.02mg
0.64mg
52%
Iron
1.4mg
4.58mg
40%
Vitamin E
2.38mg
8.33mg
40%
Monounsaturated fat
8.32g
24.426g
40%
Fats
25.1g
49.24g
37%
Vitamin B5
1.767mg
35%
Fiber
0g
8.5g
34%
Cholesterol
95mg
0mg
32%
Magnesium
60mg
168mg
26%
Zinc
1.1mg
3.27mg
20%
Phosphorus
254mg
376mg
17%
Protein
18.5g
25.8g
15%
Calories
305kcal
567kcal
13%
Choline
101.6mg
52.5mg
9%
Vitamin K
7.8µg
0µg
7%
Carbs
0g
16.13g
5%
Potassium
520mg
705mg
5%
Vitamin A
47µg
0µg
5%
Vitamin B6
0.41mg
0.348mg
5%
Vitamin B2
0.19mg
0.135mg
4%
Saturated fat
7.148g
6.279g
4%
Calcium
66mg
92mg
3%
Protein per 100 calories
6.1g
4.6g
N/A
Calories per 10 g protein
165kcal
220kcal
N/A
Weight per 100 calories
33g
18g
N/A
Unsaturated / Saturated Fat ratio
2
6.4
N/A
Net carbs
0g
7.63g
N/A
Sugar
0g
4.72g
N/A
Tryptophan
0.25mg
0%
Threonine
0.883mg
0%
Isoleucine
0.907mg
0%
Leucine
1.672mg
0%
Lysine
0.926mg
0%
Methionine
0.317mg
0%
Phenylalanine
1.377mg
0%
Valine
1.082mg
0%
Histidine
0.652mg
0%
Omega-3 - EPA
1.619g
0g
N/A
Omega-3 - DHA
2.965g
0g
N/A
Omega-3 - DPA
0.391g
0g
N/A
Macronutrient Comparison
Macronutrient breakdown side-by-side comparison
2
19%
25%
43%
13%
Protein:
18.5 g
Fats:
25.1 g
Carbs:
0 g
Water:
43 g
Other:
13.4 g
3
26%
49%
16%
7%
2%
Protein:
25.8 g
Fats:
49.24 g
Carbs:
16.13 g
Water:
6.5 g
Other:
2.33 g
Contains
more
Water Water
+561.5%
Contains
more
Other Other
+475.1%
Contains
more
Protein Protein
+39.5%
Contains
more
Fats Fats
+96.2%
Contains
more
Carbs Carbs
+∞%
Fat Type Comparison
Fat type breakdown side-by-side comparison
0
33%
38%
29%
Saturated fat:
Sat. Fat
7.148 g
Monounsaturated fat:
Mono. Fat
8.32 g
Polyunsaturated fat:
Poly. Fat
6.21 g
3
14%
53%
34%
Saturated fat:
Sat. Fat
6.279 g
Monounsaturated fat:
Mono. Fat
24.426 g
Polyunsaturated fat:
Poly. Fat
15.558 g
Contains
less
Sat. Fat Saturated fat
-12.2%
Contains
more
Mono. Fat Monounsaturated fat
+193.6%
Contains
more
Poly. Fat Polyunsaturated fat
+150.5%