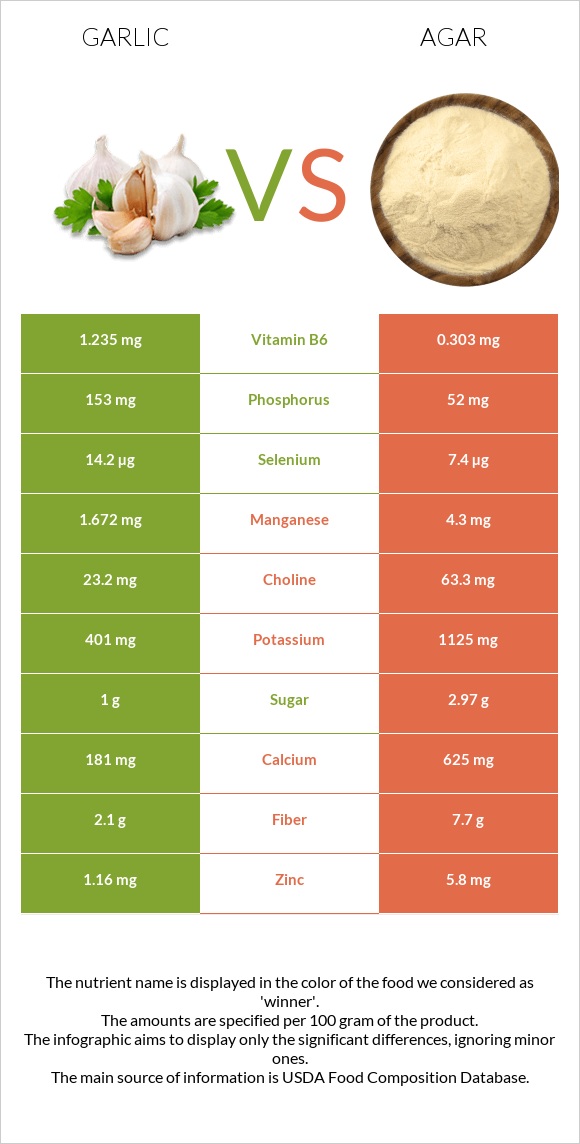
How are garlic and agar different? Garlic is richer in vitamin B6 and vitamin C, while agar is higher in iron, magnesium, folate, manganese, vitamin B5, calcium, zinc, and copper. Agar covers your daily need for iron, 246% more than garlic. Garlic, raw and Seaweed, agar, dried types were used in this article.
Infographic
Mineral Comparison
Mineral comparison score is based on the number of minerals by which one or the other food is richer. The "coverage" charts below show how much of the daily needs can be covered by 300 grams of the food.
3
100 g
300 g
1 tsp - 2.8g 1 clove - 3g 3 cloves - 9g 1 cup - 136g
Magnesium
Magnesium
Calcium
Calcium
Potassium
Potassium
Iron
Iron
Copper
Copper
Zinc
Zinc
Phosphorus
Phosphorus
Sodium
Sodium
Manganese
Manganese
Selenium
Selenium
18%
54%
35%
64%
100%
32%
66%
2.2%
218%
77%
7
100 g
300 g
Magnesium
Magnesium
Calcium
Calcium
Potassium
Potassium
Iron
Iron
Copper
Copper
Zinc
Zinc
Phosphorus
Phosphorus
Sodium
Sodium
Manganese
Manganese
Selenium
Selenium
550%
188%
99%
803%
203%
158%
22%
13%
561%
40%
Vitamin Comparison
Vitamin comparison score is based on the number of vitamins by which one or the other food is richer. The "coverage" charts below show how much of the daily needs can be covered by 300 grams of the food.
4
100 g
300 g
1 tsp - 2.8g 1 clove - 3g 3 cloves - 9g 1 cup - 136g
Vitamin C
Vit. C
Vitamin D
Vit. D
Vitamin A
Vit. A
Vitamin E
Vit. E
Vitamin B1
Vit. B1
Vitamin B2
Vit. B2
Vitamin B3
Vit. B3
Vitamin B5
Vit. B5
Vitamin B6
Vit. B6
Vitamin B12
Vit. B12
Vitamin K
Vit. K
Folate
Folate
104%
0%
0%
1.6%
50%
25%
13%
36%
285%
0%
4.3%
2.3%
5
100 g
300 g
Vitamin C
Vit. C
Vitamin D
Vit. D
Vitamin A
Vit. A
Vitamin E
Vit. E
Vitamin B1
Vit. B1
Vitamin B2
Vit. B2
Vitamin B3
Vit. B3
Vitamin B5
Vit. B5
Vitamin B6
Vit. B6
Vitamin B12
Vit. B12
Vitamin K
Vit. K
Folate
Folate
0%
0%
0%
100%
2.5%
51%
3.8%
181%
70%
0%
61%
435%
All nutrients comparison - raw data values
Nutrient
DV% diff.
Iron
1.7mg
21.4mg
246%
Magnesium
25mg
770mg
177%
Folate
3µg
580µg
144%
Manganese
1.672mg
4.3mg
114%
Vitamin B6
1.235mg
0.303mg
72%
Vitamin B5
0.596mg
3.018mg
48%
Calcium
181mg
625mg
44%
Zinc
1.16mg
5.8mg
42%
Vitamin C
31.2mg
0mg
35%
Copper
0.299mg
0.61mg
35%
Vitamin E
0.08mg
5mg
33%
Fiber
2.1g
7.7g
22%
Potassium
401mg
1125mg
21%
Vitamin K
1.7µg
24.4µg
19%
Carbs
33.06g
80.88g
16%
Vitamin B1
0.2mg
0.01mg
16%
Phosphorus
153mg
52mg
14%
Selenium
14.2µg
7.4µg
12%
Vitamin B2
0.11mg
0.222mg
9%
Calories
149kcal
306kcal
8%
Choline
23.2mg
63.3mg
7%
Sodium
17mg
102mg
4%
Vitamin B3
0.7mg
0.202mg
3%
Polyunsaturated fat
0.249g
0.102g
1%
Protein
6.36g
6.21g
0%
Protein per 100 calories
4.3g
2g
N/A
Calories per 10 g protein
234kcal
493kcal
N/A
Weight per 100 calories
67g
33g
N/A
Fats
0.5g
0.3g
0%
Net carbs
30.96g
73.18g
N/A
Sugar
1g
2.97g
N/A
Saturated fat
0.089g
0.061g
0%
Monounsaturated fat
0.011g
0.027g
0%
Tryptophan
0.066mg
0%
Threonine
0.157mg
0%
Isoleucine
0.217mg
0%
Leucine
0.308mg
0%
Lysine
0.273mg
0%
Methionine
0.076mg
0%
Phenylalanine
0.183mg
0%
Valine
0.291mg
0%
Histidine
0.113mg
0%
Omega-3 - EPA
0g
0.087g
N/A
Macronutrient Comparison
Macronutrient breakdown side-by-side comparison
3
6%
33%
59%
Protein:
6.36 g
Fats:
0.5 g
Carbs:
33.06 g
Water:
58.58 g
Other:
1.5 g
2
6%
81%
9%
4%
Protein:
6.21 g
Fats:
0.3 g
Carbs:
80.88 g
Water:
8.68 g
Other:
3.93 g
Contains
more
Fats Fats
+66.7%
Contains
more
Water Water
+574.9%
Contains
more
Carbs Carbs
+144.6%
Contains
more
Other Other
+162%
Fat Type Comparison
Fat type breakdown side-by-side comparison
1
26%
3%
71%
Saturated fat:
Sat. Fat
0.089 g
Monounsaturated fat:
Mono. Fat
0.011 g
Polyunsaturated fat:
Poly. Fat
0.249 g
2
32%
14%
54%
Saturated fat:
Sat. Fat
0.061 g
Monounsaturated fat:
Mono. Fat
0.027 g
Polyunsaturated fat:
Poly. Fat
0.102 g
Contains
more
Poly. Fat Polyunsaturated fat
+144.1%
Contains
less
Sat. Fat Saturated fat
-31.5%
Contains
more
Mono. Fat Monounsaturated fat
+145.5%