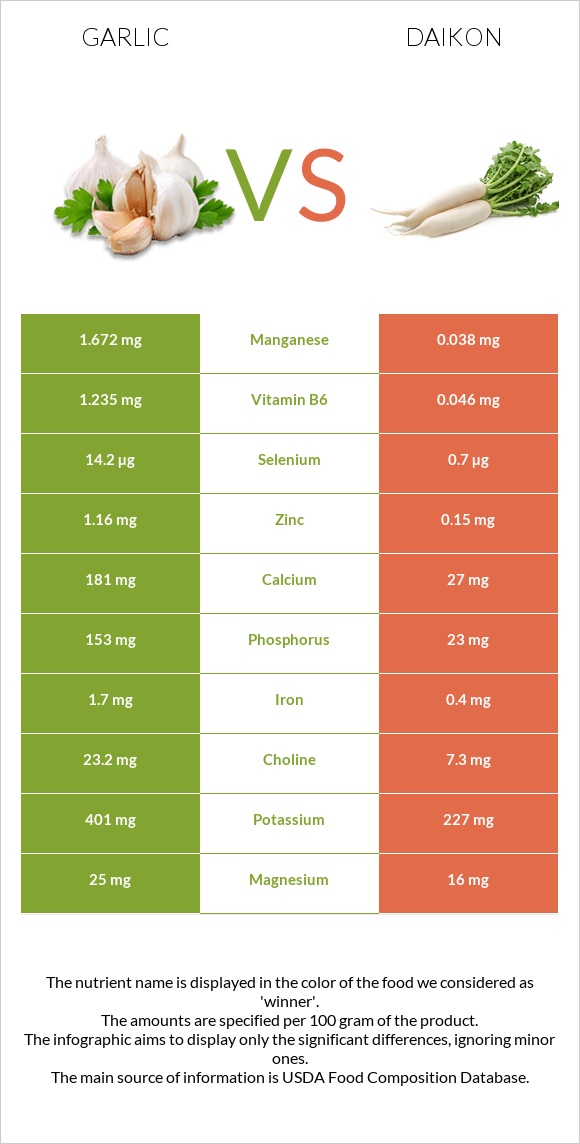
A recap on the differences between garlic and daikon Daikon has less vitamin B6, manganese, selenium, copper, phosphorus, iron, calcium, vitamin B1, vitamin C, and zinc. Garlic covers your daily vitamin B6 needs 91% more than daikon. Daikon contains 44 times less manganese than garlic. Garlic contains 1.672mg of manganese, while daikon contains 0.038mg. Food varieties used in this article are Garlic, raw and Radishes, oriental, raw .
Infographic
Mineral Comparison
Mineral comparison score is based on the number of minerals by which one or the other food is richer. The "coverage" charts below show how much of the daily needs can be covered by 300 grams of the food.
10
100 g
300 g
1 tsp - 2.8g 1 clove - 3g 3 cloves - 9g 1 cup - 136g
Magnesium
Magnesium
Calcium
Calcium
Potassium
Potassium
Iron
Iron
Copper
Copper
Zinc
Zinc
Phosphorus
Phosphorus
Sodium
Sodium
Manganese
Manganese
Selenium
Selenium
18%
54%
35%
64%
100%
32%
66%
2.2%
218%
77%
0
100 g
300 g
1 cup slices - 116g 1 radish (7" long) - 338g
Magnesium
Magnesium
Calcium
Calcium
Potassium
Potassium
Iron
Iron
Copper
Copper
Zinc
Zinc
Phosphorus
Phosphorus
Sodium
Sodium
Manganese
Manganese
Selenium
Selenium
11%
8.1%
20%
15%
38%
4.1%
9.9%
2.7%
5%
3.8%
Vitamin Comparison
Vitamin comparison score is based on the number of vitamins by which one or the other food is richer. The "coverage" charts below show how much of the daily needs can be covered by 300 grams of the food.
8
100 g
300 g
1 tsp - 2.8g 1 clove - 3g 3 cloves - 9g 1 cup - 136g
Vitamin C
Vit. C
Vitamin D
Vit. D
Vitamin A
Vit. A
Vitamin E
Vit. E
Vitamin B1
Vit. B1
Vitamin B2
Vit. B2
Vitamin B3
Vit. B3
Vitamin B5
Vit. B5
Vitamin B6
Vit. B6
Vitamin B12
Vit. B12
Vitamin K
Vit. K
Folate
Folate
104%
0%
0%
1.6%
50%
25%
13%
36%
285%
0%
4.3%
2.3%
1
100 g
300 g
1 cup slices - 116g 1 radish (7" long) - 338g
Vitamin C
Vit. C
Vitamin D
Vit. D
Vitamin A
Vit. A
Vitamin E
Vit. E
Vitamin B1
Vit. B1
Vitamin B2
Vit. B2
Vitamin B3
Vit. B3
Vitamin B5
Vit. B5
Vitamin B6
Vit. B6
Vitamin B12
Vit. B12
Vitamin K
Vit. K
Folate
Folate
73%
0%
0%
0%
5%
4.6%
3.8%
8.3%
11%
0%
0.75%
21%
All nutrients comparison - raw data values
Nutrient
DV% diff.
Vitamin B6
1.235mg
0.046mg
91%
Manganese
1.672mg
0.038mg
71%
Selenium
14.2µg
0.7µg
25%
Copper
0.299mg
0.115mg
20%
Phosphorus
153mg
23mg
19%
Iron
1.7mg
0.4mg
16%
Calcium
181mg
27mg
15%
Vitamin B1
0.2mg
0.02mg
15%
Protein
6.36g
0.6g
12%
Vitamin C
31.2mg
22mg
10%
Carbs
33.06g
4.1g
10%
Zinc
1.16mg
0.15mg
9%
Vitamin B5
0.596mg
0.138mg
9%
Calories
149kcal
18kcal
7%
Vitamin B2
0.11mg
0.02mg
7%
Folate
3µg
28µg
6%
Potassium
401mg
227mg
5%
Vitamin B3
0.7mg
0.2mg
3%
Choline
23.2mg
7.3mg
3%
Magnesium
25mg
16mg
2%
Fiber
2.1g
1.6g
2%
Fats
0.5g
0.1g
1%
Vitamin E
0.08mg
0mg
1%
Vitamin K
1.7µg
0.3µg
1%
Polyunsaturated fat
0.249g
0.045g
1%
Protein per 100 calories
4.3g
3.3g
N/A
Calories per 10 g protein
234kcal
300kcal
N/A
Weight per 100 calories
67g
556g
N/A
Net carbs
30.96g
2.5g
N/A
Sugar
1g
2.5g
N/A
Sodium
17mg
21mg
0%
Saturated fat
0.089g
0.03g
0%
Monounsaturated fat
0.011g
0.017g
0%
Tryptophan
0.066mg
0.003mg
0%
Threonine
0.157mg
0.025mg
0%
Isoleucine
0.217mg
0.026mg
0%
Leucine
0.308mg
0.031mg
0%
Lysine
0.273mg
0.03mg
0%
Methionine
0.076mg
0.006mg
0%
Phenylalanine
0.183mg
0.02mg
0%
Valine
0.291mg
0.028mg
0%
Histidine
0.113mg
0.011mg
0%
Macronutrient Comparison
Macronutrient breakdown side-by-side comparison
4
6%
33%
59%
Protein:
6.36 g
Fats:
0.5 g
Carbs:
33.06 g
Water:
58.58 g
Other:
1.5 g
1
4%
95%
Protein:
0.6 g
Fats:
0.1 g
Carbs:
4.1 g
Water:
94.62 g
Other:
0.58 g
Contains
more
Protein Protein
+960%
Contains
more
Fats Fats
+400%
Contains
more
Carbs Carbs
+706.3%
Contains
more
Other Other
+158.6%
Contains
more
Water Water
+61.5%
Fat Type Comparison
Fat type breakdown side-by-side comparison
1
26%
3%
71%
Saturated fat:
Sat. Fat
0.089 g
Monounsaturated fat:
Mono. Fat
0.011 g
Polyunsaturated fat:
Poly. Fat
0.249 g
2
33%
18%
49%
Saturated fat:
Sat. Fat
0.03 g
Monounsaturated fat:
Mono. Fat
0.017 g
Polyunsaturated fat:
Poly. Fat
0.045 g
Contains
more
Poly. Fat Polyunsaturated fat
+453.3%
Contains
less
Sat. Fat Saturated fat
-66.3%
Contains
more
Mono. Fat Monounsaturated fat
+54.5%