How are guava and broccoli different? Guava is higher in vitamin C, copper, and fiber; however, broccoli is richer in vitamin K, vitamin B2, and iron. Daily need coverage for vitamin C for guava is 155% higher. Guava contains 5 times more copper than broccoli. While guava contains 0.23mg of copper, broccoli contains only 0.049mg. Guavas, common, raw and Broccoli, raw are the varieties used in this article.
Infographic
Mineral Comparison
Mineral comparison score is based on the number of minerals by which one or the other food is richer. The "coverage" charts below show how much of the daily needs can be covered by 300 grams of the food.
3
100 g
300 g
1 fruit, without refuse - 55g 1 cup - 165g
Magnesium
Magnesium
Calcium
Calcium
Potassium
Potassium
Iron
Iron
Copper
Copper
Zinc
Zinc
Phosphorus
Phosphorus
Sodium
Sodium
Manganese
Manganese
Selenium
Selenium
16%
5.4%
37%
9.8%
77%
6.3%
17%
0.26%
20%
3.3%
6
100 g
300 g
1 spear (about 5" long) - 31g 0.5 cup, chopped or diced - 44g 1 cup chopped - 91g 1 NLEA serving - 148g 1 stalk - 151g 1 bunch - 608g
Magnesium
Magnesium
Calcium
Calcium
Potassium
Potassium
Iron
Iron
Copper
Copper
Zinc
Zinc
Phosphorus
Phosphorus
Sodium
Sodium
Manganese
Manganese
Selenium
Selenium
15%
14%
28%
27%
16%
11%
28%
4.3%
27%
14%
Vitamin Comparison
Vitamin comparison score is based on the number of vitamins by which one or the other food is richer. The "coverage" charts below show how much of the daily needs can be covered by 300 grams of the food.
2
100 g
300 g
1 fruit, without refuse - 55g 1 cup - 165g
Vitamin C
Vit. C
Vitamin D
Vit. D
Vitamin A
Vit. A
Vitamin E
Vit. E
Vitamin B1
Vit. B1
Vitamin B2
Vit. B2
Vitamin B3
Vit. B3
Vitamin B5
Vit. B5
Vitamin B6
Vit. B6
Vitamin B12
Vit. B12
Vitamin K
Vit. K
Folate
Folate
761%
0%
10%
15%
17%
9.2%
20%
27%
25%
0%
6.5%
37%
5
100 g
300 g
1 spear (about 5" long) - 31g 0.5 cup, chopped or diced - 44g 1 cup chopped - 91g 1 NLEA serving - 148g 1 stalk - 151g 1 bunch - 608g
Vitamin C
Vit. C
Vitamin D
Vit. D
Vitamin A
Vit. A
Vitamin E
Vit. E
Vitamin B1
Vit. B1
Vitamin B2
Vit. B2
Vitamin B3
Vit. B3
Vitamin B5
Vit. B5
Vitamin B6
Vit. B6
Vitamin B12
Vit. B12
Vitamin K
Vit. K
Folate
Folate
297%
0%
10%
16%
18%
27%
12%
34%
40%
0%
254%
47%
All nutrients comparison - raw data values
Nutrient
DV% diff.
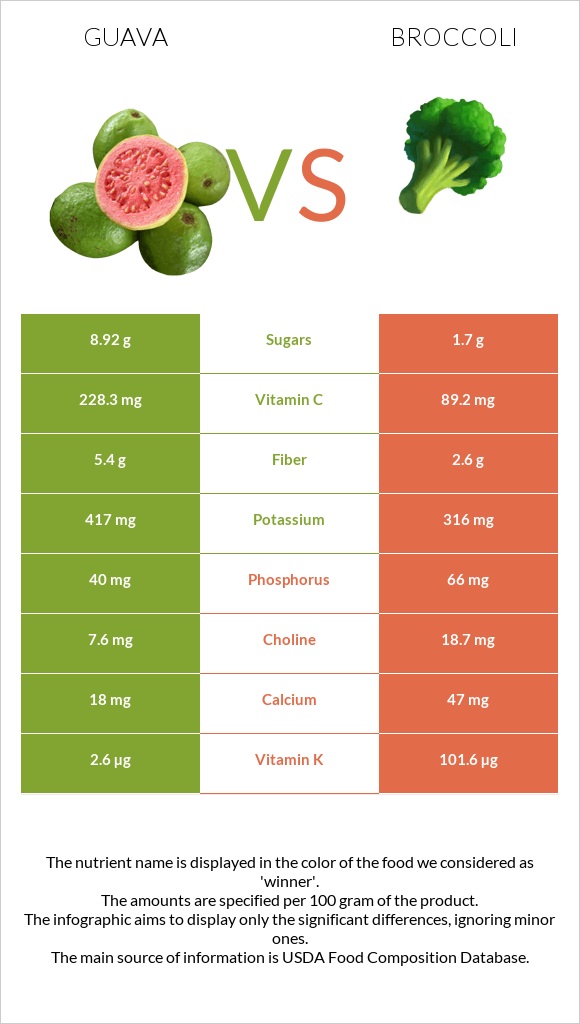
Vitamin C
228.3mg
89.2mg
155%
Vitamin K
2.6µg
101.6µg
83%
Copper
0.23mg
0.049mg
20%
Fiber
5.4g
2.6g
11%
Iron
0.26mg
0.73mg
6%
Vitamin B2
0.04mg
0.117mg
6%
Vitamin B6
0.11mg
0.175mg
5%
Phosphorus
40mg
66mg
4%
Folate
49µg
63µg
4%
Carbs
14.32g
6.64g
3%
Calcium
18mg
47mg
3%
Potassium
417mg
316mg
3%
Manganese
0.15mg
0.21mg
3%
Selenium
0.6µg
2.5µg
3%
Vitamin B3
1.084mg
0.639mg
3%
Calories
68kcal
34kcal
2%
Zinc
0.23mg
0.41mg
2%
Vitamin B5
0.451mg
0.573mg
2%
Choline
7.6mg
18.7mg
2%
Polyunsaturated fat
0.401g
0.038g
2%
Protein
2.55g
2.82g
1%
Fats
0.95g
0.37g
1%
Sodium
2mg
33mg
1%
Saturated fat
0.272g
0.039g
1%
Fructose
0.68g
1%
Protein per 100 calories
3.8g
8.3g
N/A
Calories per 10 g protein
267kcal
121kcal
N/A
Weight per 100 calories
147g
294g
N/A
Net carbs
8.92g
4.04g
N/A
Magnesium
22mg
21mg
0%
Sugar
8.92g
1.7g
N/A
Vitamin A
31µg
31µg
0%
Vitamin E
0.73mg
0.78mg
0%
Vitamin B1
0.067mg
0.071mg
0%
Monounsaturated fat
0.087g
0.011g
0%
Tryptophan
0.022mg
0.033mg
0%
Threonine
0.096mg
0.088mg
0%
Isoleucine
0.093mg
0.079mg
0%
Leucine
0.171mg
0.129mg
0%
Lysine
0.072mg
0.135mg
0%
Methionine
0.016mg
0.038mg
0%
Phenylalanine
0.006mg
0.117mg
0%
Valine
0.087mg
0.125mg
0%
Histidine
0.022mg
0.059mg
0%
Macronutrient Comparison
Macronutrient breakdown side-by-side comparison
3
3%
14%
81%
Protein:
2.55 g
Fats:
0.95 g
Carbs:
14.32 g
Water:
80.8 g
Other:
1.38 g
2
3%
7%
89%
Protein:
2.82 g
Fats:
0.37 g
Carbs:
6.64 g
Water:
89.3 g
Other:
0.87 g
Contains
more
Fats Fats
+156.8%
Contains
more
Carbs Carbs
+115.7%
Contains
more
Other Other
+58.6%
Contains
more
Protein Protein
+10.6%
Contains
more
Water Water
+10.5%
Fat Type Comparison
Fat type breakdown side-by-side comparison
2
36%
11%
53%
Saturated fat:
Sat. Fat
0.272 g
Monounsaturated fat:
Mono. Fat
0.087 g
Polyunsaturated fat:
Poly. Fat
0.401 g
1
44%
13%
43%
Saturated fat:
Sat. Fat
0.039 g
Monounsaturated fat:
Mono. Fat
0.011 g
Polyunsaturated fat:
Poly. Fat
0.038 g
Contains
more
Mono. Fat Monounsaturated fat
+690.9%
Contains
more
Poly. Fat Polyunsaturated fat
+955.3%
Contains
less
Sat. Fat Saturated fat
-85.7%