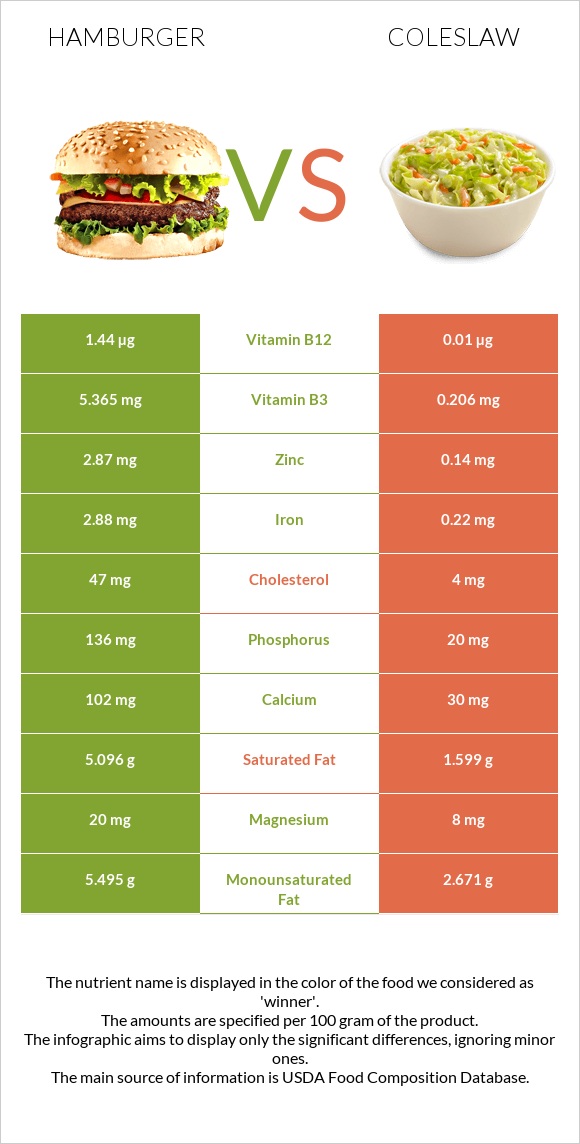
What are the differences between hamburgers and coleslaw? Hamburgers are higher in vitamin B12, iron, vitamin B3, zinc, vitamin B2, phosphorus, and vitamin B1, yet coleslaw is higher in vitamin C. Hamburgers' daily need coverage for vitamin B12 is 60% more. Hamburgers have 26 times more vitamin B3 than coleslaw. While hamburgers have 5.365mg of vitamin B3, coleslaw has only 0.206mg. The amount of cholesterol in coleslaw is lower. The glycemic index of coleslaw is lower. We used Fast foods, hamburger; double, regular, patty; plain and Fast foods, coleslaw types in this article.
Infographic
Mineral Comparison
Mineral comparison score is based on the number of minerals by which one or the other food is richer. The "coverage" charts below show how much of the daily needs can be covered by 300 grams of the food.
8
100 g
300 g
1 item - 120g
Magnesium
Magnesium
Calcium
Calcium
Potassium
Potassium
Iron
Iron
Copper
Copper
Zinc
Zinc
Phosphorus
Phosphorus
Sodium
Sodium
Manganese
Manganese
Selenium
Selenium
14%
31%
20%
108%
30%
78%
58%
54%
28%
0%
1
100 g
300 g
1 package - 116g 1 cup - 191g
Magnesium
Magnesium
Calcium
Calcium
Potassium
Potassium
Iron
Iron
Copper
Copper
Zinc
Zinc
Phosphorus
Phosphorus
Sodium
Sodium
Manganese
Manganese
Selenium
Selenium
5.7%
9%
11%
8.3%
5%
3.8%
8.6%
26%
13%
0%
Vitamin Comparison
Vitamin comparison score is based on the number of vitamins by which one or the other food is richer. The "coverage" charts below show how much of the daily needs can be covered by 300 grams of the food.
7
100 g
300 g
1 item - 120g
Vitamin C
Vit. C
Vitamin D
Vit. D
Vitamin A
Vit. A
Vitamin E
Vit. E
Vitamin B1
Vit. B1
Vitamin B2
Vit. B2
Vitamin B3
Vit. B3
Vitamin B5
Vit. B5
Vitamin B6
Vit. B6
Vitamin B12
Vit. B12
Vitamin K
Vit. K
Folate
Folate
0%
0%
0%
0%
54%
58%
101%
19%
47%
180%
0%
42%
4
100 g
300 g
1 package - 116g 1 cup - 191g
Vitamin C
Vit. C
Vitamin D
Vit. D
Vitamin A
Vit. A
Vitamin E
Vit. E
Vitamin B1
Vit. B1
Vitamin B2
Vit. B2
Vitamin B3
Vit. B3
Vitamin B5
Vit. B5
Vitamin B6
Vit. B6
Vitamin B12
Vit. B12
Vitamin K
Vit. K
Folate
Folate
49%
0%
9.3%
11%
6.5%
4.6%
3.9%
15%
26%
1.3%
177%
0%
All nutrients comparison - raw data values
Nutrient
DV% diff.
Vitamin B12
1.44µg
0.01µg
60%
Vitamin K
70.9µg
59%
Iron
2.88mg
0.22mg
33%
Polyunsaturated fat
0.38g
5.348g
33%
Protein
17.08g
0.95g
32%
Vitamin B3
5.365mg
0.206mg
32%
Zinc
2.87mg
0.14mg
25%
Vitamin B2
0.25mg
0.02mg
18%
Phosphorus
136mg
20mg
17%
Vitamin C
0mg
14.6mg
16%
Vitamin B1
0.217mg
0.026mg
16%
Saturated fat
5.096g
1.599g
16%
Cholesterol
47mg
4mg
14%
Folate
56µg
14%
Sodium
414mg
203mg
9%
Copper
0.091mg
0.015mg
8%
Calories
295kcal
153kcal
7%
Fats
14.36g
9.91g
7%
Calcium
102mg
30mg
7%
Vitamin B6
0.203mg
0.112mg
7%
Monounsaturated fat
5.495g
2.671g
7%
Manganese
0.217mg
0.102mg
5%
Fiber
0.9g
1.9g
4%
Vitamin E
0.54mg
4%
Carbs
24.1g
14.89g
3%
Magnesium
20mg
8mg
3%
Potassium
226mg
129mg
3%
Vitamin A
0µg
28µg
3%
Vitamin B5
0.31mg
0.246mg
1%
Fructose
2.03g
1.44g
1%
Protein per 100 calories
5.8g
0.62g
N/A
Calories per 10 g protein
173kcal
1611kcal
N/A
Weight per 100 calories
34g
65g
N/A
Unsaturated / Saturated Fat ratio
1.2
5
N/A
Net carbs
23.2g
12.99g
N/A
Sugar
4.15g
12.19g
N/A
Trans fat
0.814g
0.037g
N/A
Tryptophan
0.206mg
0%
Threonine
0.666mg
0%
Isoleucine
0.716mg
0%
Leucine
1.319mg
0%
Lysine
1.226mg
0%
Methionine
0.37mg
0%
Phenylalanine
0.677mg
0%
Valine
0.823mg
0%
Histidine
0.505mg
0%
Omega-3 - EPA
0.006g
N/A
Omega-3 - DHA
0.001g
N/A
Omega-3 - ALA
0.279g
N/A
Omega-3 - Eicosatrienoic acid
0.001g
N/A
Omega-6 - Gamma-linoleic acid
0.024g
N/A
Omega-6 - Dihomo-gamma-linoleic acid
0.006g
N/A
Omega-6 - Eicosadienoic acid
0.002g
N/A
Omega-6 - Linoleic acid
4.979g
N/A
Macronutrient Comparison
Macronutrient breakdown side-by-side comparison
4
17%
14%
24%
43%
2%
Protein:
17.08 g
Fats:
14.36 g
Carbs:
24.1 g
Water:
42.67 g
Other:
1.79 g
1
10%
15%
73%
Protein:
0.95 g
Fats:
9.91 g
Carbs:
14.89 g
Water:
73.42 g
Other:
0.83 g
Contains
more
Protein Protein
+1697.9%
Contains
more
Fats Fats
+44.9%
Contains
more
Carbs Carbs
+61.9%
Contains
more
Other Other
+115.7%
Contains
more
Water Water
+72.1%
Fat Type Comparison
Fat type breakdown side-by-side comparison
1
46%
50%
3%
Saturated fat:
Sat. Fat
5.096 g
Monounsaturated fat:
Mono. Fat
5.495 g
Polyunsaturated fat:
Poly. Fat
0.38 g
2
17%
28%
56%
Saturated fat:
Sat. Fat
1.599 g
Monounsaturated fat:
Mono. Fat
2.671 g
Polyunsaturated fat:
Poly. Fat
5.348 g
Contains
more
Mono. Fat Monounsaturated fat
+105.7%
Contains
less
Sat. Fat Saturated fat
-68.6%
Contains
more
Poly. Fat Polyunsaturated fat
+1307.4%
Carbohydrate type comparison
Carbohydrate type breakdown side-by-side comparison
3
5%
28%
49%
3%
14%
Starch:
0 g
Sucrose:
0.22 g
Glucose:
1.16 g
Fructose:
2.03 g
Lactose:
0.13 g
Maltose:
0.6 g
Galactose:
0 g
3
74%
14%
12%
Starch:
0 g
Sucrose:
8.96 g
Glucose:
1.69 g
Fructose:
1.44 g
Lactose:
0 g
Maltose:
0 g
Galactose:
0.09 g
Contains
more
Fructose Fructose
+41%
Contains
more
Lactose Lactose
+∞%
Contains
more
Maltose Maltose
+∞%
Contains
more
Sucrose Sucrose
+3972.7%
Contains
more
Glucose Glucose
+45.7%
Contains
more
Galactose Galactose
+∞%