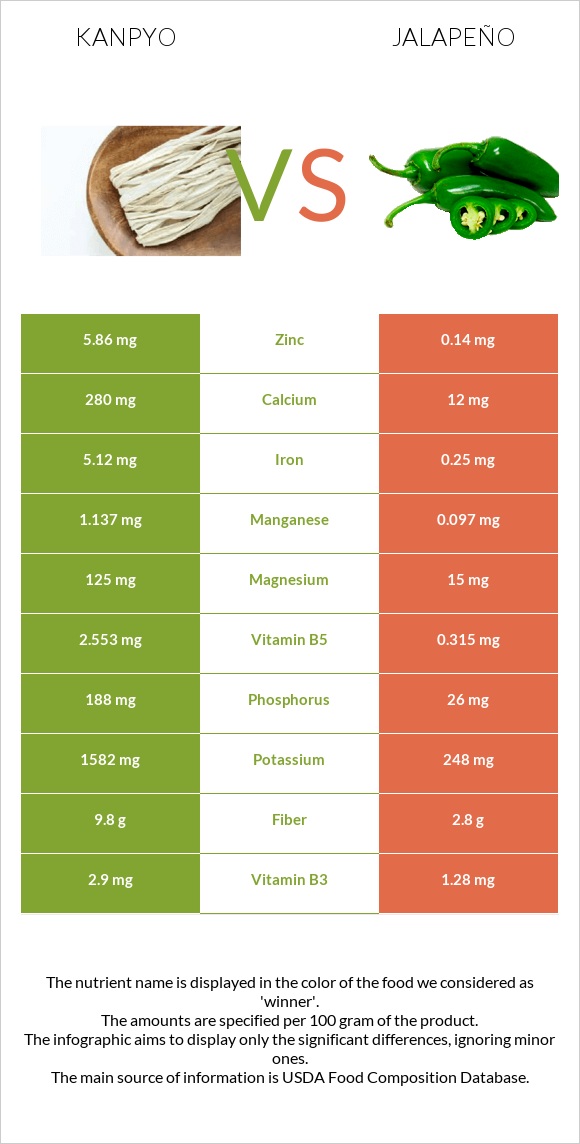
What are the main differences between kanpyo and jalapeño? Kanpyo is richer in iron, zinc, manganese, vitamin B5, copper, potassium, fiber, calcium, and magnesium, while jalapeño is higher in vitamin C. Jalapeño's daily need coverage for vitamin C is 132% higher. Jalapeño has 42 times less zinc than kanpyo. Kanpyo has 5.86mg of zinc, while jalapeño has 0.14mg. We used Kanpyo, (dried gourd strips) and Peppers, jalapeno, raw types in this comparison.
Infographic
Mineral Comparison
Mineral comparison score is based on the number of minerals by which one or the other food is richer. The "coverage" charts below show how much of the daily needs can be covered by 300 grams of the food.
9
100 g
300 g
1 strip - 6.3g 0.5 cup - 27g
Magnesium
Magnesium
Calcium
Calcium
Potassium
Potassium
Iron
Iron
Copper
Copper
Zinc
Zinc
Phosphorus
Phosphorus
Sodium
Sodium
Manganese
Manganese
Selenium
Selenium
89%
84%
140%
192%
144%
160%
81%
2%
148%
14%
1
100 g
300 g
1 pepper - 14g 1 cup, sliced - 90g
Magnesium
Magnesium
Calcium
Calcium
Potassium
Potassium
Iron
Iron
Copper
Copper
Zinc
Zinc
Phosphorus
Phosphorus
Sodium
Sodium
Manganese
Manganese
Selenium
Selenium
11%
3.6%
22%
9.4%
15%
3.8%
11%
0.39%
13%
2.2%
Vitamin Comparison
Vitamin comparison score is based on the number of vitamins by which one or the other food is richer. The "coverage" charts below show how much of the daily needs can be covered by 300 grams of the food.
4
100 g
300 g
1 strip - 6.3g 0.5 cup - 27g
Vitamin C
Vit. C
Vitamin D
Vit. D
Vitamin A
Vit. A
Vitamin E
Vit. E
Vitamin B1
Vit. B1
Vitamin B2
Vit. B2
Vitamin B3
Vit. B3
Vitamin B5
Vit. B5
Vitamin B6
Vit. B6
Vitamin B12
Vit. B12
Vitamin K
Vit. K
Folate
Folate
0.67%
0%
0%
0%
0%
10%
54%
153%
123%
0%
0%
46%
6
100 g
300 g
1 pepper - 14g 1 cup, sliced - 90g
Vitamin C
Vit. C
Vitamin D
Vit. D
Vitamin A
Vit. A
Vitamin E
Vit. E
Vitamin B1
Vit. B1
Vitamin B2
Vit. B2
Vitamin B3
Vit. B3
Vitamin B5
Vit. B5
Vitamin B6
Vit. B6
Vitamin B12
Vit. B12
Vitamin K
Vit. K
Folate
Folate
395%
0%
18%
72%
10%
16%
24%
19%
97%
0%
46%
20%
All nutrients comparison - raw data values
Nutrient
DV% diff.
Vitamin C
0.2mg
118.6mg
132%
Iron
5.12mg
0.25mg
61%
Zinc
5.86mg
0.14mg
52%
Manganese
1.137mg
0.097mg
45%
Vitamin B5
2.553mg
0.315mg
45%
Copper
0.433mg
0.046mg
43%
Potassium
1582mg
248mg
39%
Fiber
9.8g
2.8g
28%
Calcium
280mg
12mg
27%
Magnesium
125mg
15mg
26%
Vitamin E
3.58mg
24%
Phosphorus
188mg
26mg
23%
Carbs
65.03g
6.5g
20%
Protein
8.58g
0.91g
15%
Vitamin K
18.5µg
15%
Calories
258kcal
29kcal
11%
Vitamin B3
2.9mg
1.28mg
10%
Vitamin B6
0.532mg
0.419mg
9%
Folate
61µg
27µg
9%
Vitamin A
54µg
6%
Selenium
2.6µg
0.4µg
4%
Vitamin B1
0mg
0.04mg
3%
Fructose
2.63g
3%
Vitamin B2
0.044mg
0.07mg
2%
Sodium
15mg
3mg
1%
Choline
7.5mg
1%
Polyunsaturated fat
0.244g
0.112g
1%
Protein per 100 calories
3.3g
3.1g
N/A
Calories per 10 g protein
301kcal
319kcal
N/A
Weight per 100 calories
39g
345g
N/A
Fats
0.56g
0.37g
0%
Net carbs
55.23g
3.7g
N/A
Sugar
4.12g
N/A
Saturated fat
0.045g
0.092g
0%
Monounsaturated fat
0.103g
0.029g
0%
Omega-3 - ALA
0.05g
N/A
Omega-6 - Linoleic acid
0.062g
N/A
Macronutrient Comparison
Macronutrient breakdown side-by-side comparison
4
9%
65%
20%
6%
Protein:
8.58 g
Fats:
0.56 g
Carbs:
65.03 g
Water:
19.97 g
Other:
5.86 g
1
7%
92%
Protein:
0.91 g
Fats:
0.37 g
Carbs:
6.5 g
Water:
91.69 g
Other:
0.53 g
Contains
more
Protein Protein
+842.9%
Contains
more
Fats Fats
+51.4%
Contains
more
Carbs Carbs
+900.5%
Contains
more
Other Other
+1005.7%
Contains
more
Water Water
+359.1%
Fat Type Comparison
Fat type breakdown side-by-side comparison
3
11%
26%
62%
Saturated fat:
Sat. Fat
0.045 g
Monounsaturated fat:
Mono. Fat
0.103 g
Polyunsaturated fat:
Poly. Fat
0.244 g
0
39%
12%
48%
Saturated fat:
Sat. Fat
0.092 g
Monounsaturated fat:
Mono. Fat
0.029 g
Polyunsaturated fat:
Poly. Fat
0.112 g
Contains
less
Sat. Fat Saturated fat
-51.1%
Contains
more
Mono. Fat Monounsaturated fat
+255.2%
Contains
more
Poly. Fat Polyunsaturated fat
+117.9%