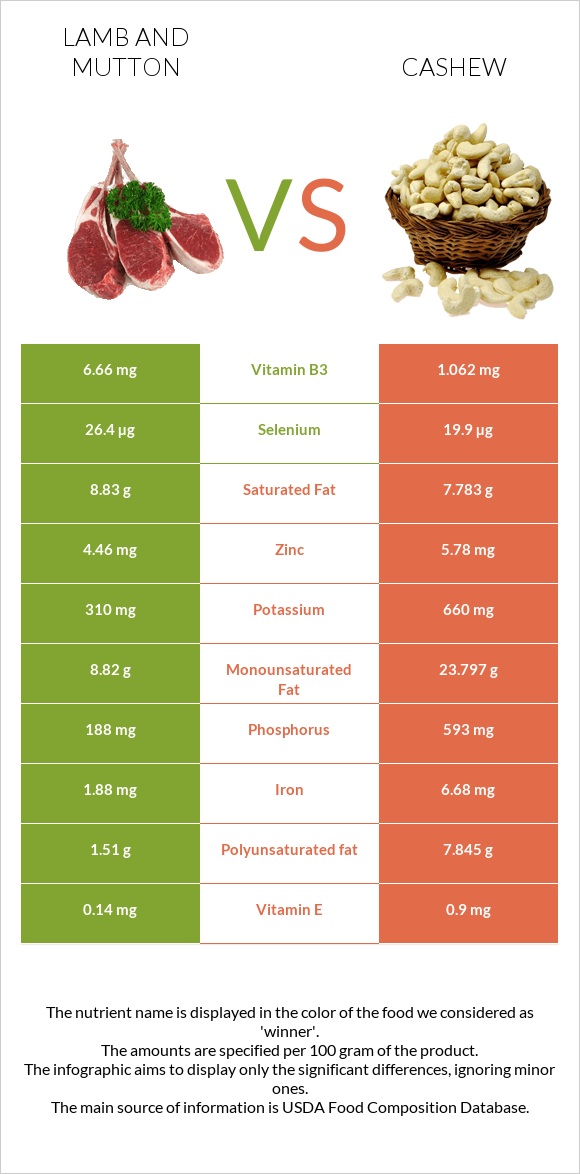
How are lamb and cashew different? Lamb is higher in vitamin B12 and vitamin B3; however, cashew is richer in copper, manganese, magnesium, iron, phosphorus, vitamin B1, and vitamin K. Daily need coverage for copper for cashew is 231% higher. Cashew has less cholesterol. Lamb has a lower glycemic index (0) than cashew (25). Lamb, domestic, composite of trimmed retail cuts, separable lean, and fat, trimmed to 1/4" fat, choice, cooked and Nuts, cashew nuts, raw are the varieties used in this article.
Infographic
Mineral Comparison
Mineral comparison score is based on the number of minerals by which one or the other food is richer. The "coverage" charts below show how much of the daily needs can be covered by 300 grams of the food.
1
100 g
300 g
3 oz - 85g 1 piece, cooked, excluding refuse (yield from 1 lb raw meat with refuse) - 242g
Magnesium
Magnesium
Calcium
Calcium
Potassium
Potassium
Iron
Iron
Copper
Copper
Zinc
Zinc
Phosphorus
Phosphorus
Sodium
Sodium
Manganese
Manganese
Selenium
Selenium
16%
5.1%
27%
71%
40%
122%
81%
9.4%
2.9%
144%
9
100 g
300 g
1 oz - 28.35g
Magnesium
Magnesium
Calcium
Calcium
Potassium
Potassium
Iron
Iron
Copper
Copper
Zinc
Zinc
Phosphorus
Phosphorus
Sodium
Sodium
Manganese
Manganese
Selenium
Selenium
209%
11%
58%
251%
732%
158%
254%
1.6%
216%
109%
Vitamin Comparison
Vitamin comparison score is based on the number of vitamins by which one or the other food is richer. The "coverage" charts below show how much of the daily needs can be covered by 300 grams of the food.
4
100 g
300 g
3 oz - 85g 1 piece, cooked, excluding refuse (yield from 1 lb raw meat with refuse) - 242g
Vitamin C
Vit. C
Vitamin D
Vit. D
Vitamin A
Vit. A
Vitamin E
Vit. E
Vitamin B1
Vit. B1
Vitamin B2
Vit. B2
Vitamin B3
Vit. B3
Vitamin B5
Vit. B5
Vitamin B6
Vit. B6
Vitamin B12
Vit. B12
Vitamin K
Vit. K
Folate
Folate
0%
1.5%
0%
2.8%
25%
58%
125%
40%
30%
319%
12%
14%
7
100 g
300 g
1 oz - 28.35g
Vitamin C
Vit. C
Vitamin D
Vit. D
Vitamin A
Vit. A
Vitamin E
Vit. E
Vitamin B1
Vit. B1
Vitamin B2
Vit. B2
Vitamin B3
Vit. B3
Vitamin B5
Vit. B5
Vitamin B6
Vit. B6
Vitamin B12
Vit. B12
Vitamin K
Vit. K
Folate
Folate
1.7%
0%
0%
18%
106%
13%
20%
52%
96%
0%
85%
19%
All nutrients comparison - raw data values
Nutrient
DV% diff.
Copper
0.119mg
2.195mg
231%
Vitamin B12
2.55µg
0µg
106%
Manganese
0.022mg
1.655mg
71%
Magnesium
23mg
292mg
64%
Iron
1.88mg
6.68mg
60%
Phosphorus
188mg
593mg
58%
Polyunsaturated fat
1.51g
7.845g
42%
Monounsaturated fat
8.82g
23.797g
37%
Fats
20.94g
43.85g
35%
Vitamin B3
6.66mg
1.062mg
35%
Cholesterol
97mg
0mg
32%
Vitamin B1
0.1mg
0.423mg
27%
Vitamin K
4.6µg
34.1µg
25%
Vitamin B6
0.13mg
0.417mg
22%
Choline
93.7mg
17%
Vitamin B2
0.25mg
0.058mg
15%
Calories
294kcal
553kcal
13%
Protein
24.52g
18.22g
13%
Fiber
0g
3.3g
13%
Zinc
4.46mg
5.78mg
12%
Selenium
26.4µg
19.9µg
12%
Carbs
0g
30.19g
10%
Potassium
310mg
660mg
10%
Starch
23.49g
10%
Vitamin E
0.14mg
0.9mg
5%
Saturated fat
8.83g
7.783g
5%
Vitamin B5
0.66mg
0.864mg
4%
Sodium
72mg
12mg
3%
Calcium
17mg
37mg
2%
Folate
18µg
25µg
2%
Vitamin C
0mg
0.5mg
1%
Vitamin D
0.1µg
0µg
1%
Protein per 100 calories
8.3g
3.3g
N/A
Calories per 10 g protein
120kcal
304kcal
N/A
Weight per 100 calories
34g
18g
N/A
Unsaturated / Saturated Fat ratio
1.2
4.1
N/A
Net carbs
0g
26.89g
N/A
Vitamin D*
2 IU
0 IU
0%
Sugar
0g
5.91g
N/A
Tryptophan
0.287mg
0.287mg
0%
Threonine
1.05mg
0.688mg
0%
Isoleucine
1.183mg
0.789mg
0%
Leucine
1.908mg
1.472mg
0%
Lysine
2.166mg
0.928mg
0%
Methionine
0.629mg
0.362mg
0%
Phenylalanine
0.998mg
0.951mg
0%
Valine
1.323mg
1.094mg
0%
Histidine
0.777mg
0.456mg
0%
Fructose
0.05g
0%
Macronutrient Comparison
Macronutrient breakdown side-by-side comparison
2
25%
21%
54%
Protein:
24.52 g
Fats:
20.94 g
Carbs:
0 g
Water:
53.72 g
Other:
0.82 g
3
18%
44%
30%
5%
3%
Protein:
18.22 g
Fats:
43.85 g
Carbs:
30.19 g
Water:
5.2 g
Other:
2.54 g
Contains
more
Protein Protein
+34.6%
Contains
more
Water Water
+933.1%
Contains
more
Fats Fats
+109.4%
Contains
more
Carbs Carbs
+∞%
Contains
more
Other Other
+209.8%
Fat Type Comparison
Fat type breakdown side-by-side comparison
0
46%
46%
8%
Saturated fat:
Sat. Fat
8.83 g
Monounsaturated fat:
Mono. Fat
8.82 g
Polyunsaturated fat:
Poly. Fat
1.51 g
3
20%
60%
20%
Saturated fat:
Sat. Fat
7.783 g
Monounsaturated fat:
Mono. Fat
23.797 g
Polyunsaturated fat:
Poly. Fat
7.845 g
Contains
less
Sat. Fat Saturated fat
-11.9%
Contains
more
Mono. Fat Monounsaturated fat
+169.8%
Contains
more
Poly. Fat Polyunsaturated fat
+419.5%