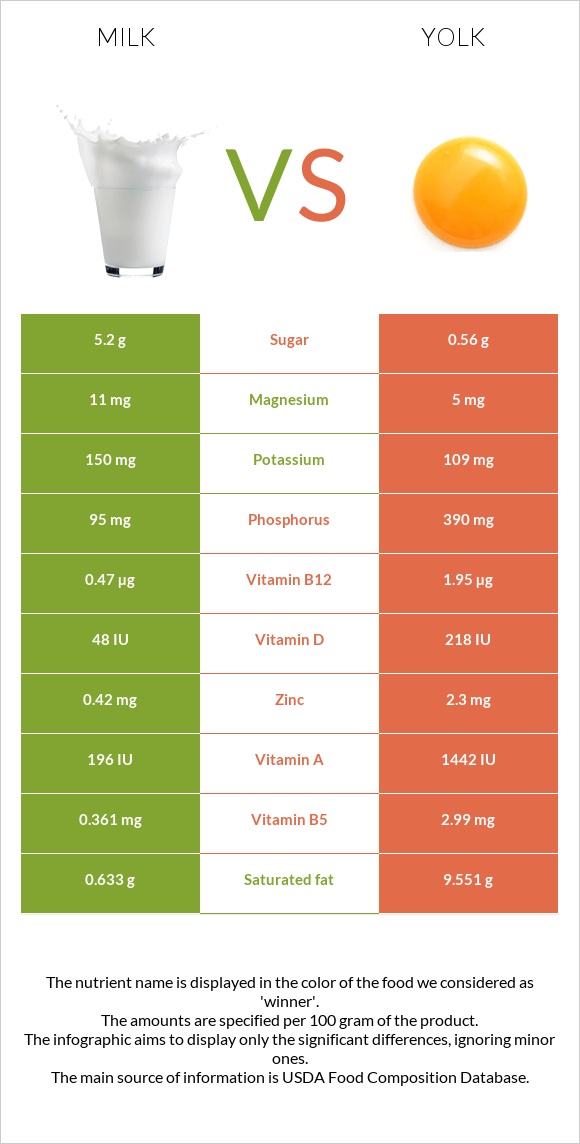
What are the differences between milk and yolk? Yolk is richer than milk in choline, selenium, vitamin B12, vitamin B5, phosphorus, folate, iron, and vitamin B2. Yolk's daily need coverage for cholesterol is 360% more. The amount of saturated fat in milk is lower. The glycemic index of yolk is lower. We used Milk, lowfat, fluid, 1% milkfat, with added vitamin A and vitamin D and Egg, yolk, raw, fresh types in this article.
Infographic
Mineral Comparison
Mineral comparison score is based on the number of minerals by which one or the other food is richer. The "coverage" charts below show how much of the daily needs can be covered by 300 grams of the food.
2
100 g
300 g
1 fl oz - 30.5g 1 cup - 244g 1 quart - 976g
Magnesium
Magnesium
Calcium
Calcium
Potassium
Potassium
Iron
Iron
Copper
Copper
Zinc
Zinc
Phosphorus
Phosphorus
Sodium
Sodium
Manganese
Manganese
Selenium
Selenium
7.9%
38%
13%
1.1%
3.3%
11%
41%
5.7%
0.39%
18%
6
100 g
300 g
1 large - 17g 1 cup - 243g
Magnesium
Magnesium
Calcium
Calcium
Potassium
Potassium
Iron
Iron
Copper
Copper
Zinc
Zinc
Phosphorus
Phosphorus
Sodium
Sodium
Manganese
Manganese
Selenium
Selenium
3.6%
39%
9.6%
102%
26%
63%
167%
6.3%
7.2%
305%
Vitamin Comparison
Vitamin comparison score is based on the number of vitamins by which one or the other food is richer. The "coverage" charts below show how much of the daily needs can be covered by 300 grams of the food.
1
100 g
300 g
1 fl oz - 30.5g 1 cup - 244g 1 quart - 976g
Vitamin C
Vit. C
Vitamin D
Vit. D
Vitamin A
Vit. A
Vitamin E
Vit. E
Vitamin B1
Vit. B1
Vitamin B2
Vit. B2
Vitamin B3
Vit. B3
Vitamin B5
Vit. B5
Vitamin B6
Vit. B6
Vitamin B12
Vit. B12
Vitamin K
Vit. K
Folate
Folate
0%
18%
19%
0.2%
5%
43%
1.7%
22%
8.5%
59%
0.25%
3.8%
10
100 g
300 g
1 large - 17g 1 cup - 243g
Vitamin C
Vit. C
Vitamin D
Vit. D
Vitamin A
Vit. A
Vitamin E
Vit. E
Vitamin B1
Vit. B1
Vitamin B2
Vit. B2
Vitamin B3
Vit. B3
Vitamin B5
Vit. B5
Vitamin B6
Vit. B6
Vitamin B12
Vit. B12
Vitamin K
Vit. K
Folate
Folate
0%
81%
127%
52%
44%
122%
0.45%
179%
81%
244%
1.8%
110%
All nutrients comparison - raw data values
Nutrient
DV% diff.
Cholesterol
5mg
1085mg
360%
Choline
17.7mg
820.2mg
146%
Selenium
3.3µg
56µg
96%
Vitamin B12
0.47µg
1.95µg
62%
Vitamin B5
0.361mg
2.99mg
53%
Phosphorus
95mg
390mg
42%
Saturated fat
0.633g
9.551g
41%
Fats
0.97g
26.54g
39%
Vitamin A
58µg
381µg
36%
Folate
5µg
146µg
35%
Iron
0.03mg
2.73mg
34%
Monounsaturated fat
0.277g
11.738g
29%
Polyunsaturated fat
0.035g
4.204g
28%
Vitamin B2
0.185mg
0.528mg
26%
Protein
3.37g
15.86g
25%
Vitamin B6
0.037mg
0.35mg
24%
Vitamin D*
48 IU
218 IU
21%
Vitamin D
1.2µg
5.4µg
21%
Zinc
0.42mg
2.3mg
17%
Vitamin E
0.01mg
2.58mg
17%
Calories
42kcal
322kcal
14%
Vitamin B1
0.02mg
0.176mg
13%
Copper
0.01mg
0.077mg
7%
Manganese
0.003mg
0.055mg
2%
Magnesium
11mg
5mg
1%
Potassium
150mg
109mg
1%
Vitamin K
0.1µg
0.7µg
1%
Protein per 100 calories
8g
4.9g
N/A
Calories per 10 g protein
125kcal
203kcal
N/A
Weight per 100 calories
238g
31g
N/A
Unsaturated / Saturated Fat ratio
0.49
1.7
N/A
Net carbs
4.99g
3.59g
N/A
Carbs
4.99g
3.59g
0%
Calcium
125mg
129mg
0%
Sugar
5.2g
0.56g
N/A
Sodium
44mg
48mg
0%
Vitamin B3
0.093mg
0.024mg
0%
Tryptophan
0.043mg
0.177mg
0%
Threonine
0.143mg
0.687mg
0%
Isoleucine
0.174mg
0.866mg
0%
Leucine
0.319mg
1.399mg
0%
Lysine
0.282mg
1.217mg
0%
Methionine
0.088mg
0.378mg
0%
Phenylalanine
0.174mg
0.681mg
0%
Valine
0.22mg
0.949mg
0%
Histidine
0.101mg
0.416mg
0%
Fructose
0g
0.07g
0%
Omega-3 - EPA
0g
0.011g
N/A
Omega-3 - DHA
0g
0.114g
N/A
Omega-3 - ALA
0.004g
N/A
Omega-6 - Linoleic acid
0.027g
N/A
Macronutrient Comparison
Macronutrient breakdown side-by-side comparison
2
3%
5%
90%
Protein:
3.37 g
Fats:
0.97 g
Carbs:
4.99 g
Water:
89.92 g
Other:
0.75 g
3
16%
27%
4%
52%
2%
Protein:
15.86 g
Fats:
26.54 g
Carbs:
3.59 g
Water:
52.31 g
Other:
1.7 g
Contains
more
Carbs Carbs
+39%
Contains
more
Water Water
+71.9%
Contains
more
Protein Protein
+370.6%
Contains
more
Fats Fats
+2636.1%
Contains
more
Other Other
+126.7%
Fat Type Comparison
Fat type breakdown side-by-side comparison
1
67%
29%
4%
Saturated fat:
Sat. Fat
0.633 g
Monounsaturated fat:
Mono. Fat
0.277 g
Polyunsaturated fat:
Poly. Fat
0.035 g
2
37%
46%
16%
Saturated fat:
Sat. Fat
9.551 g
Monounsaturated fat:
Mono. Fat
11.738 g
Polyunsaturated fat:
Poly. Fat
4.204 g
Contains
less
Sat. Fat Saturated fat
-93.4%
Contains
more
Mono. Fat Monounsaturated fat
+4137.5%
Contains
more
Poly. Fat Polyunsaturated fat
+11911.4%
Carbohydrate type comparison
Carbohydrate type breakdown side-by-side comparison
1
100%
Starch:
0 g
Sucrose:
0 g
Glucose:
0 g
Fructose:
0 g
Lactose:
5.2 g
Maltose:
0 g
Galactose:
0 g
5
13%
34%
13%
13%
13%
13%
Starch:
0 g
Sucrose:
0.07 g
Glucose:
0.18 g
Fructose:
0.07 g
Lactose:
0.07 g
Maltose:
0.07 g
Galactose:
0.07 g
Contains
more
Lactose Lactose
+7328.6%
Contains
more
Sucrose Sucrose
+∞%
Contains
more
Glucose Glucose
+∞%
Contains
more
Fructose Fructose
+∞%
Contains
more
Maltose Maltose
+∞%
Contains
more
Galactose Galactose
+∞%