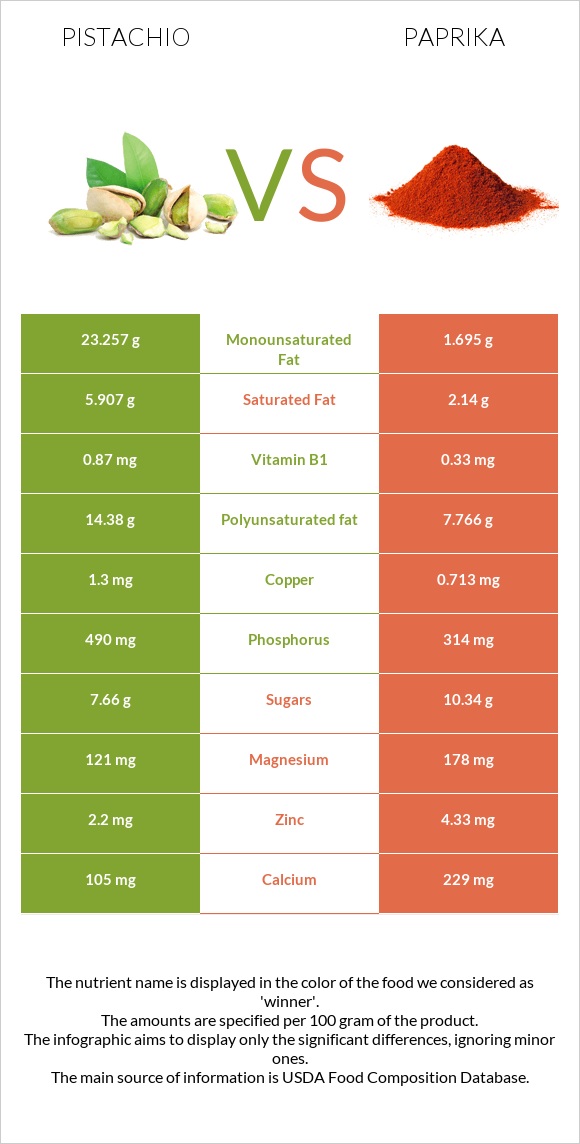
How are pistachios and paprika different? Pistachios are higher in copper and vitamin B1; however, paprika is richer in vitamin A, iron, vitamin E, fiber, vitamin B2, vitamin B3, vitamin B5, and potassium. Daily need coverage for vitamin A for paprika is 975% higher. Pistachios contain 3 times more vitamin B1 than paprika. While pistachios contain 0.87mg of vitamin B1, paprika contains only 0.33mg. Paprika has a lower glycemic index (0) than pistachios (28). Nuts, pistachio nuts, raw and Spices, paprika are the varieties used in this article.
Infographic
Mineral Comparison
Mineral comparison score is based on the number of minerals by which one or the other food is richer. The "coverage" charts below show how much of the daily needs can be covered by 300 grams of the food.
3
100 g
300 g
1 kernel - 0.7g 1 oz (49 kernels) - 28.35g 1 cup - 123g
Magnesium
Magnesium
Calcium
Calcium
Potassium
Potassium
Iron
Iron
Copper
Copper
Zinc
Zinc
Phosphorus
Phosphorus
Sodium
Sodium
Manganese
Manganese
Selenium
Selenium
86%
32%
90%
147%
433%
60%
210%
0.13%
157%
38%
6
100 g
300 g
0.25 tsp - 0.5g 1 tbsp - 6.8g
Magnesium
Magnesium
Calcium
Calcium
Potassium
Potassium
Iron
Iron
Copper
Copper
Zinc
Zinc
Phosphorus
Phosphorus
Sodium
Sodium
Manganese
Manganese
Selenium
Selenium
127%
69%
201%
793%
238%
118%
135%
8.9%
207%
34%
Vitamin Comparison
Vitamin comparison score is based on the number of vitamins by which one or the other food is richer. The "coverage" charts below show how much of the daily needs can be covered by 300 grams of the food.
2
100 g
300 g
1 kernel - 0.7g 1 oz (49 kernels) - 28.35g 1 cup - 123g
Vitamin C
Vit. C
Vitamin D
Vit. D
Vitamin A
Vit. A
Vitamin E
Vit. E
Vitamin B1
Vit. B1
Vitamin B2
Vit. B2
Vitamin B3
Vit. B3
Vitamin B5
Vit. B5
Vitamin B6
Vit. B6
Vitamin B12
Vit. B12
Vitamin K
Vit. K
Folate
Folate
19%
0%
8.7%
57%
218%
37%
24%
31%
392%
0%
0%
38%
7
100 g
300 g
0.25 tsp - 0.5g 1 tbsp - 6.8g
Vitamin C
Vit. C
Vitamin D
Vit. D
Vitamin A
Vit. A
Vitamin E
Vit. E
Vitamin B1
Vit. B1
Vitamin B2
Vit. B2
Vitamin B3
Vit. B3
Vitamin B5
Vit. B5
Vitamin B6
Vit. B6
Vitamin B12
Vit. B12
Vitamin K
Vit. K
Folate
Folate
3%
0%
821%
582%
83%
284%
189%
151%
494%
0%
201%
37%
All nutrients comparison - raw data values
Nutrient
DV% diff.
Vitamin A
26µg
2463µg
271%
Iron
3.92mg
21.14mg
215%
Vitamin E
2.86mg
29.1mg
175%
Fiber
10.6g
34.9g
97%
Vitamin B2
0.16mg
1.23mg
82%
Vitamin K
80.3µg
67%
Copper
1.3mg
0.713mg
65%
Vitamin B3
1.3mg
10.06mg
55%
Monounsaturated fat
23.257g
1.695g
54%
Fats
45.32g
12.89g
50%
Vitamin B1
0.87mg
0.33mg
45%
Polyunsaturated fat
14.38g
7.766g
44%
Vitamin B5
0.52mg
2.51mg
40%
Potassium
1025mg
2280mg
37%
Vitamin B6
1.7mg
2.141mg
34%
Phosphorus
490mg
314mg
25%
Zinc
2.2mg
4.33mg
19%
Manganese
1.2mg
1.59mg
17%
Saturated fat
5.907g
2.14g
17%
Calories
560kcal
282kcal
14%
Magnesium
121mg
178mg
14%
Protein
20.16g
14.14g
12%
Calcium
105mg
229mg
12%
Carbs
27.17g
53.99g
9%
Choline
51.5mg
9%
Fructose
0.24g
6.71g
8%
Vitamin C
5.6mg
0.9mg
5%
Sodium
1mg
68mg
3%
Starch
1.67g
1%
Selenium
7µg
6.3µg
1%
Folate
51µg
49µg
1%
Protein per 100 calories
3.6g
5g
N/A
Calories per 10 g protein
278kcal
199kcal
N/A
Weight per 100 calories
18g
35g
N/A
Unsaturated / Saturated Fat ratio
6.4
4.4
N/A
Net carbs
16.57g
19.09g
N/A
Sugar
7.66g
10.34g
N/A
Tryptophan
0.251mg
0.07mg
0%
Threonine
0.684mg
0.49mg
0%
Isoleucine
0.917mg
0.57mg
0%
Leucine
1.604mg
0.92mg
0%
Lysine
1.138mg
0.69mg
0%
Methionine
0.36mg
0.2mg
0%
Phenylalanine
1.092mg
0.61mg
0%
Valine
1.249mg
0.75mg
0%
Histidine
0.512mg
0.25mg
0%
Omega-3 - ALA
0.453g
N/A
Omega-6 - Linoleic acid
14.091g
N/A
Macronutrient Comparison
Macronutrient breakdown side-by-side comparison
2
20%
45%
27%
4%
3%
Protein:
20.16 g
Fats:
45.32 g
Carbs:
27.17 g
Water:
4.37 g
Other:
2.98 g
3
14%
13%
54%
11%
8%
Protein:
14.14 g
Fats:
12.89 g
Carbs:
53.99 g
Water:
11.24 g
Other:
7.74 g
Contains
more
Protein Protein
+42.6%
Contains
more
Fats Fats
+251.6%
Contains
more
Carbs Carbs
+98.7%
Contains
more
Water Water
+157.2%
Contains
more
Other Other
+159.7%
Fat Type Comparison
Fat type breakdown side-by-side comparison
2
14%
53%
33%
Saturated fat:
Sat. Fat
5.907 g
Monounsaturated fat:
Mono. Fat
23.257 g
Polyunsaturated fat:
Poly. Fat
14.38 g
1
18%
15%
67%
Saturated fat:
Sat. Fat
2.14 g
Monounsaturated fat:
Mono. Fat
1.695 g
Polyunsaturated fat:
Poly. Fat
7.766 g
Contains
more
Mono. Fat Monounsaturated fat
+1272.1%
Contains
more
Poly. Fat Polyunsaturated fat
+85.2%
Contains
less
Sat. Fat Saturated fat
-63.8%
Carbohydrate type comparison
Carbohydrate type breakdown side-by-side comparison
3
18%
74%
3%
3%
2%
Starch:
1.67 g
Sucrose:
6.87 g
Glucose:
0.32 g
Fructose:
0.24 g
Lactose:
0 g
Maltose:
0.17 g
Galactose:
0 g
3
8%
25%
65%
2%
Starch:
0 g
Sucrose:
0.81 g
Glucose:
2.63 g
Fructose:
6.71 g
Lactose:
0 g
Maltose:
0 g
Galactose:
0.19 g
Contains
more
Starch Starch
+∞%
Contains
more
Sucrose Sucrose
+748.1%
Contains
more
Maltose Maltose
+∞%
Contains
more
Glucose Glucose
+721.9%
Contains
more
Fructose Fructose
+2695.8%
Contains
more
Galactose Galactose
+∞%