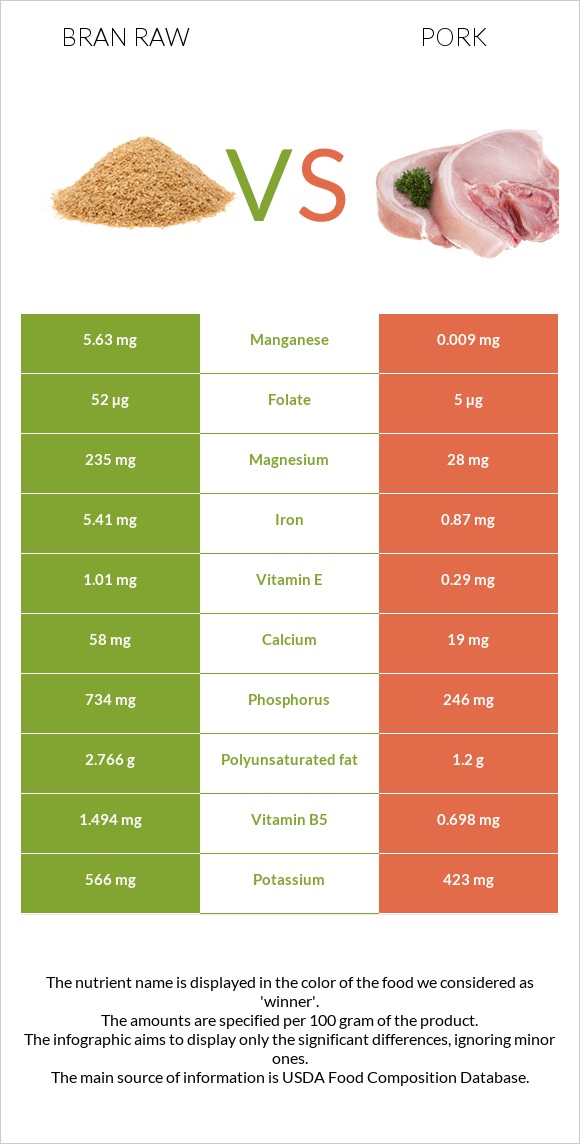
A recap on the differences between bran raw and pork Bran raw has more manganese, phosphorus, fiber, iron, magnesium, copper, and vitamin B1; however, pork is higher in vitamin B12 and vitamin B3. Bran raw covers your daily manganese needs 244% more than pork. The glycemic index of bran raw is higher. Food varieties used in this article are Oat bran, raw and Pork, fresh, loin, whole, separable lean, and fat, cooked, broiled .
Infographic
Mineral Comparison
Mineral comparison score is based on the number of minerals by which one or the other food is richer. The "coverage" charts below show how much of the daily needs can be covered by 300 grams of the food.
9
100 g
300 g
1 cup - 94g
Magnesium
Magnesium
Calcium
Calcium
Potassium
Potassium
Iron
Iron
Copper
Copper
Zinc
Zinc
Phosphorus
Phosphorus
Sodium
Sodium
Manganese
Manganese
Selenium
Selenium
168%
17%
50%
203%
134%
85%
315%
0.52%
734%
247%
0
100 g
300 g
3 oz - 85g 1 chop, excluding refuse (yield from 1 raw chop, with refuse, weighing 151 g) - 87g
Magnesium
Magnesium
Calcium
Calcium
Potassium
Potassium
Iron
Iron
Copper
Copper
Zinc
Zinc
Phosphorus
Phosphorus
Sodium
Sodium
Manganese
Manganese
Selenium
Selenium
20%
5.7%
37%
33%
24%
65%
105%
8.1%
1.2%
247%
Vitamin Comparison
Vitamin comparison score is based on the number of vitamins by which one or the other food is richer. The "coverage" charts below show how much of the daily needs can be covered by 300 grams of the food.
5
100 g
300 g
1 cup - 94g
Vitamin C
Vit. C
Vitamin D
Vit. D
Vitamin A
Vit. A
Vitamin E
Vit. E
Vitamin B1
Vit. B1
Vitamin B2
Vit. B2
Vitamin B3
Vit. B3
Vitamin B5
Vit. B5
Vitamin B6
Vit. B6
Vitamin B12
Vit. B12
Vitamin K
Vit. K
Folate
Folate
0%
0%
0%
20%
293%
51%
18%
90%
38%
0%
8%
39%
7
100 g
300 g
3 oz - 85g 1 chop, excluding refuse (yield from 1 raw chop, with refuse, weighing 151 g) - 87g
Vitamin C
Vit. C
Vitamin D
Vit. D
Vitamin A
Vit. A
Vitamin E
Vit. E
Vitamin B1
Vit. B1
Vitamin B2
Vit. B2
Vitamin B3
Vit. B3
Vitamin B5
Vit. B5
Vitamin B6
Vit. B6
Vitamin B12
Vit. B12
Vitamin K
Vit. K
Folate
Folate
2%
20%
0.67%
5.8%
219%
74%
94%
42%
107%
88%
0%
3.8%
All nutrients comparison - raw data values
Nutrient
DV% diff.
Manganese
5.63mg
0.009mg
244%
Phosphorus
734mg
246mg
70%
Fiber
15.4g
0g
62%
Iron
5.41mg
0.87mg
57%
Magnesium
235mg
28mg
49%
Copper
0.403mg
0.073mg
37%
Vitamin B12
0µg
0.7µg
29%
Cholesterol
0mg
80mg
27%
Vitamin B3
0.934mg
5.037mg
26%
Vitamin B1
1.17mg
0.877mg
24%
Vitamin B6
0.165mg
0.464mg
23%
Carbs
66.22g
0g
22%
Protein
17.3g
27.32g
20%
Saturated fat
1.328g
5.23g
18%
Vitamin B5
1.494mg
0.698mg
16%
Folate
52µg
5µg
12%
Fats
7.03g
13.92g
11%
Choline
32.2mg
93.9mg
11%
Monounsaturated fat
2.376g
6.19g
10%
Polyunsaturated fat
2.766g
1.2g
10%
Vitamin B2
0.22mg
0.321mg
8%
Vitamin D*
0 IU
53 IU
7%
Vitamin D
0µg
1.3µg
7%
Zinc
3.11mg
2.39mg
7%
Vitamin E
1.01mg
0.29mg
5%
Calcium
58mg
19mg
4%
Potassium
566mg
423mg
4%
Sodium
4mg
62mg
3%
Vitamin K
3.2µg
0µg
3%
Vitamin C
0mg
0.6mg
1%
Calories
246kcal
242kcal
0%
Protein per 100 calories
7g
11g
N/A
Calories per 10 g protein
142kcal
89kcal
N/A
Weight per 100 calories
41g
41g
N/A
Unsaturated / Saturated Fat ratio
3.9
1.4
N/A
Net carbs
50.82g
0g
N/A
Sugar
1.45g
0g
N/A
Vitamin A
0µg
2µg
0%
Selenium
45.2µg
45.3µg
0%
Tryptophan
0.335mg
0.338mg
0%
Threonine
0.502mg
1.234mg
0%
Isoleucine
0.668mg
1.26mg
0%
Leucine
1.374mg
2.177mg
0%
Lysine
0.76mg
2.446mg
0%
Methionine
0.335mg
0.712mg
0%
Phenylalanine
0.908mg
1.086mg
0%
Valine
0.964mg
1.473mg
0%
Histidine
0.41mg
1.067mg
0%
Macronutrient Comparison
Macronutrient breakdown side-by-side comparison
2
17%
7%
66%
7%
3%
Protein:
17.3 g
Fats:
7.03 g
Carbs:
66.22 g
Water:
6.55 g
Other:
2.9 g
3
27%
14%
58%
Protein:
27.32 g
Fats:
13.92 g
Carbs:
0 g
Water:
57.87 g
Other:
0.89 g
Contains
more
Carbs Carbs
+∞%
Contains
more
Other Other
+225.8%
Contains
more
Protein Protein
+57.9%
Contains
more
Fats Fats
+98%
Contains
more
Water Water
+783.5%
Fat Type Comparison
Fat type breakdown side-by-side comparison
2
21%
37%
43%
Saturated fat:
Sat. Fat
1.328 g
Monounsaturated fat:
Mono. Fat
2.376 g
Polyunsaturated fat:
Poly. Fat
2.766 g
1
41%
49%
10%
Saturated fat:
Sat. Fat
5.23 g
Monounsaturated fat:
Mono. Fat
6.19 g
Polyunsaturated fat:
Poly. Fat
1.2 g
Contains
less
Sat. Fat Saturated fat
-74.6%
Contains
more
Poly. Fat Polyunsaturated fat
+130.5%
Contains
more
Mono. Fat Monounsaturated fat
+160.5%