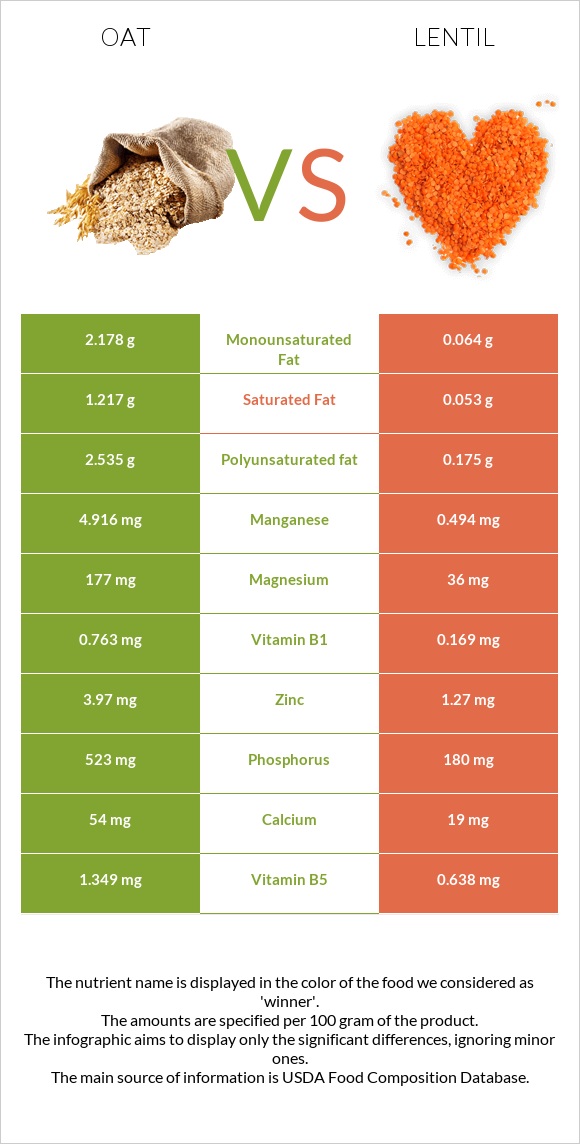
How are oats and lentil different? Oats are richer in manganese, vitamin B1, phosphorus, copper, magnesium, zinc, iron, vitamin B5, and fiber, while lentil is higher in folate. Oats cover your daily need for manganese, 192% more than lentil. Oats contain 5 times more magnesium than lentil. Oats contain 177mg of magnesium, while lentil contains 36mg. Oats have a higher glycemic index (59) than lentil (29). Oats and Lentils, mature seeds, cooked, boiled, without salt types were used in this article.
Infographic
Mineral Comparison
Mineral comparison score is based on the number of minerals by which one or the other food is richer. The "coverage" charts below show how much of the daily needs can be covered by 300 grams of the food.
8
100 g
300 g
1 cup - 156g
Magnesium
Magnesium
Calcium
Calcium
Potassium
Potassium
Iron
Iron
Copper
Copper
Zinc
Zinc
Phosphorus
Phosphorus
Sodium
Sodium
Manganese
Manganese
Selenium
Selenium
126%
16%
38%
177%
209%
108%
224%
0.26%
641%
0%
1
100 g
300 g
1 tbsp - 12.3g 1 cup - 198g
Magnesium
Magnesium
Calcium
Calcium
Potassium
Potassium
Iron
Iron
Copper
Copper
Zinc
Zinc
Phosphorus
Phosphorus
Sodium
Sodium
Manganese
Manganese
Selenium
Selenium
26%
5.7%
33%
125%
84%
35%
77%
0.26%
64%
15%
Vitamin Comparison
Vitamin comparison score is based on the number of vitamins by which one or the other food is richer. The "coverage" charts below show how much of the daily needs can be covered by 300 grams of the food.
3
100 g
300 g
1 cup - 156g
Vitamin C
Vit. C
Vitamin D
Vit. D
Vitamin A
Vit. A
Vitamin E
Vit. E
Vitamin B1
Vit. B1
Vitamin B2
Vit. B2
Vitamin B3
Vit. B3
Vitamin B5
Vit. B5
Vitamin B6
Vit. B6
Vitamin B12
Vit. B12
Vitamin K
Vit. K
Folate
Folate
0%
0%
0%
0%
191%
32%
18%
81%
27%
0%
0%
42%
6
100 g
300 g
1 tbsp - 12.3g 1 cup - 198g
Vitamin C
Vit. C
Vitamin D
Vit. D
Vitamin A
Vit. A
Vitamin E
Vit. E
Vitamin B1
Vit. B1
Vitamin B2
Vit. B2
Vitamin B3
Vit. B3
Vitamin B5
Vit. B5
Vitamin B6
Vit. B6
Vitamin B12
Vit. B12
Vitamin K
Vit. K
Folate
Folate
5%
0%
0%
2.2%
42%
17%
20%
38%
41%
0%
4.3%
136%
All nutrients comparison - raw data values
Nutrient
DV% diff.
Manganese
4.916mg
0.494mg
192%
Vitamin B1
0.763mg
0.169mg
50%
Phosphorus
523mg
180mg
49%
Copper
0.626mg
0.251mg
42%
Magnesium
177mg
36mg
34%
Folate
56µg
181µg
31%
Zinc
3.97mg
1.27mg
25%
Iron
4.72mg
3.33mg
17%
Protein
16.89g
9.02g
16%
Polyunsaturated fat
2.535g
0.175g
16%
Carbs
66.27g
20.13g
15%
Calories
389kcal
116kcal
14%
Vitamin B5
1.349mg
0.638mg
14%
Fiber
10.6g
7.9g
11%
Fats
6.9g
0.38g
10%
Choline
32.7mg
6%
Selenium
2.8µg
5%
Vitamin B2
0.139mg
0.073mg
5%
Vitamin B6
0.119mg
0.178mg
5%
Saturated fat
1.217g
0.053g
5%
Monounsaturated fat
2.178g
0.064g
5%
Calcium
54mg
19mg
4%
Vitamin C
0mg
1.5mg
2%
Potassium
429mg
369mg
2%
Vitamin E
0.11mg
1%
Vitamin B3
0.961mg
1.06mg
1%
Vitamin K
1.7µg
1%
Protein per 100 calories
4.3g
7.8g
N/A
Calories per 10 g protein
230kcal
129kcal
N/A
Weight per 100 calories
26g
86g
N/A
Unsaturated / Saturated Fat ratio
3.9
4.5
N/A
Net carbs
55.67g
12.23g
N/A
Sugar
1.8g
N/A
Sodium
2mg
2mg
0%
Tryptophan
0.234mg
0.081mg
0%
Threonine
0.575mg
0.323mg
0%
Isoleucine
0.694mg
0.39mg
0%
Leucine
1.284mg
0.654mg
0%
Lysine
0.701mg
0.63mg
0%
Methionine
0.312mg
0.077mg
0%
Phenylalanine
0.895mg
0.445mg
0%
Valine
0.937mg
0.448mg
0%
Histidine
0.405mg
0.254mg
0%
Macronutrient Comparison
Macronutrient breakdown side-by-side comparison
4
17%
7%
66%
8%
2%
Protein:
16.89 g
Fats:
6.9 g
Carbs:
66.27 g
Water:
8.22 g
Other:
1.72 g
1
9%
20%
70%
Protein:
9.02 g
Fats:
0.38 g
Carbs:
20.13 g
Water:
69.64 g
Other:
0.83 g
Contains
more
Protein Protein
+87.3%
Contains
more
Fats Fats
+1715.8%
Contains
more
Carbs Carbs
+229.2%
Contains
more
Other Other
+107.2%
Contains
more
Water Water
+747.2%
Fat Type Comparison
Fat type breakdown side-by-side comparison
2
21%
37%
43%
Saturated fat:
Sat. Fat
1.217 g
Monounsaturated fat:
Mono. Fat
2.178 g
Polyunsaturated fat:
Poly. Fat
2.535 g
1
18%
22%
60%
Saturated fat:
Sat. Fat
0.053 g
Monounsaturated fat:
Mono. Fat
0.064 g
Polyunsaturated fat:
Poly. Fat
0.175 g
Contains
more
Mono. Fat Monounsaturated fat
+3303.1%
Contains
more
Poly. Fat Polyunsaturated fat
+1348.6%
Contains
less
Sat. Fat Saturated fat
-95.6%