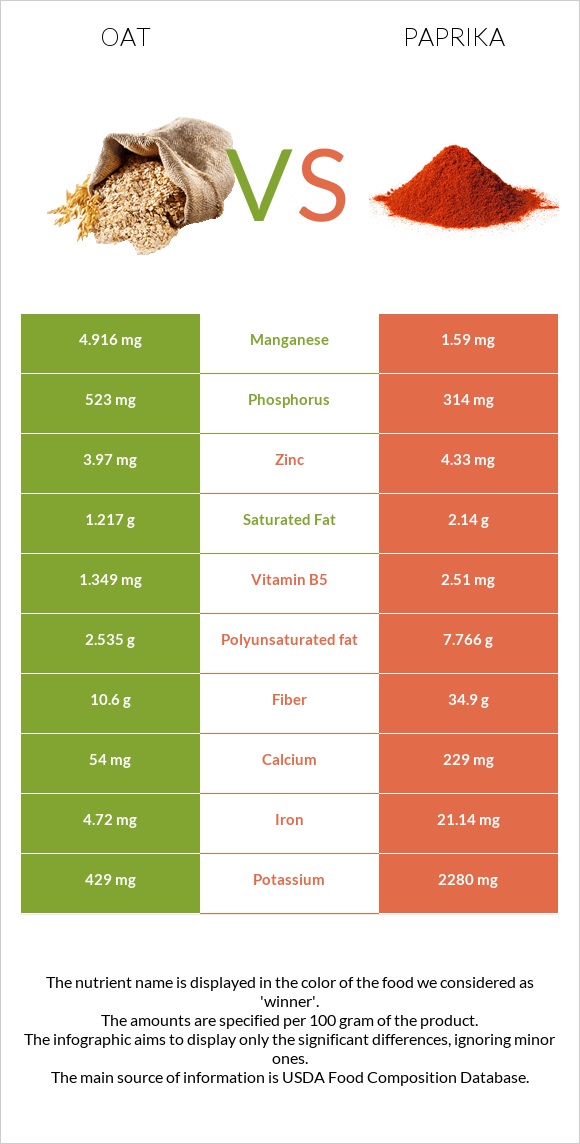
What are the main differences between oats and paprika? Oats are richer in manganese, vitamin B1, and phosphorus, while paprika is higher in vitamin A, iron, vitamin B6, fiber, vitamin B2, vitamin B3, and potassium. Paprika's daily need coverage for vitamin A is 985% higher. Paprika has 3 times less manganese than oats. Oats have 4.916mg of manganese, while paprika has 1.59mg. Oats have a higher glycemic index (59) than paprika (0). We used Oats and Spices, paprika types in this comparison.
Infographic
Mineral Comparison
Mineral comparison score is based on the number of minerals by which one or the other food is richer. The "coverage" charts below show how much of the daily needs can be covered by 300 grams of the food.
3
100 g
300 g
1 cup - 156g
Magnesium
Magnesium
Calcium
Calcium
Potassium
Potassium
Iron
Iron
Copper
Copper
Zinc
Zinc
Phosphorus
Phosphorus
Sodium
Sodium
Manganese
Manganese
Selenium
Selenium
126%
16%
38%
177%
209%
108%
224%
0.26%
641%
0%
5
100 g
300 g
0.25 tsp - 0.5g 1 tbsp - 6.8g
Magnesium
Magnesium
Calcium
Calcium
Potassium
Potassium
Iron
Iron
Copper
Copper
Zinc
Zinc
Phosphorus
Phosphorus
Sodium
Sodium
Manganese
Manganese
Selenium
Selenium
127%
69%
201%
793%
238%
118%
135%
8.9%
207%
34%
Vitamin Comparison
Vitamin comparison score is based on the number of vitamins by which one or the other food is richer. The "coverage" charts below show how much of the daily needs can be covered by 300 grams of the food.
2
100 g
300 g
1 cup - 156g
Vitamin C
Vit. C
Vitamin D
Vit. D
Vitamin A
Vit. A
Vitamin E
Vit. E
Vitamin B1
Vit. B1
Vitamin B2
Vit. B2
Vitamin B3
Vit. B3
Vitamin B5
Vit. B5
Vitamin B6
Vit. B6
Vitamin B12
Vit. B12
Vitamin K
Vit. K
Folate
Folate
0%
0%
0%
0%
191%
32%
18%
81%
27%
0%
0%
42%
8
100 g
300 g
0.25 tsp - 0.5g 1 tbsp - 6.8g
Vitamin C
Vit. C
Vitamin D
Vit. D
Vitamin A
Vit. A
Vitamin E
Vit. E
Vitamin B1
Vit. B1
Vitamin B2
Vit. B2
Vitamin B3
Vit. B3
Vitamin B5
Vit. B5
Vitamin B6
Vit. B6
Vitamin B12
Vit. B12
Vitamin K
Vit. K
Folate
Folate
3%
0%
821%
582%
83%
284%
189%
151%
494%
0%
201%
37%
All nutrients comparison - raw data values
Nutrient
DV% diff.
Vitamin A
0µg
2463µg
274%
Iron
4.72mg
21.14mg
205%
Vitamin E
29.1mg
194%
Vitamin B6
0.119mg
2.141mg
156%
Manganese
4.916mg
1.59mg
145%
Fiber
10.6g
34.9g
97%
Vitamin B2
0.139mg
1.23mg
84%
Vitamin K
80.3µg
67%
Vitamin B3
0.961mg
10.06mg
57%
Potassium
429mg
2280mg
54%
Vitamin B1
0.763mg
0.33mg
36%
Polyunsaturated fat
2.535g
7.766g
35%
Phosphorus
523mg
314mg
30%
Vitamin B5
1.349mg
2.51mg
23%
Calcium
54mg
229mg
18%
Selenium
6.3µg
11%
Copper
0.626mg
0.713mg
10%
Fats
6.9g
12.89g
9%
Choline
51.5mg
9%
Fructose
6.71g
8%
Protein
16.89g
14.14g
6%
Calories
389kcal
282kcal
5%
Carbs
66.27g
53.99g
4%
Saturated fat
1.217g
2.14g
4%
Zinc
3.97mg
4.33mg
3%
Sodium
2mg
68mg
3%
Folate
56µg
49µg
2%
Vitamin C
0mg
0.9mg
1%
Monounsaturated fat
2.178g
1.695g
1%
Protein per 100 calories
4.3g
5g
N/A
Calories per 10 g protein
230kcal
199kcal
N/A
Weight per 100 calories
26g
35g
N/A
Unsaturated / Saturated Fat ratio
3.9
4.4
N/A
Net carbs
55.67g
19.09g
N/A
Magnesium
177mg
178mg
0%
Sugar
10.34g
N/A
Tryptophan
0.234mg
0.07mg
0%
Threonine
0.575mg
0.49mg
0%
Isoleucine
0.694mg
0.57mg
0%
Leucine
1.284mg
0.92mg
0%
Lysine
0.701mg
0.69mg
0%
Methionine
0.312mg
0.2mg
0%
Phenylalanine
0.895mg
0.61mg
0%
Valine
0.937mg
0.75mg
0%
Histidine
0.405mg
0.25mg
0%
Omega-3 - ALA
0.453g
N/A
Macronutrient Comparison
Macronutrient breakdown side-by-side comparison
2
17%
7%
66%
8%
2%
Protein:
16.89 g
Fats:
6.9 g
Carbs:
66.27 g
Water:
8.22 g
Other:
1.72 g
3
14%
13%
54%
11%
8%
Protein:
14.14 g
Fats:
12.89 g
Carbs:
53.99 g
Water:
11.24 g
Other:
7.74 g
Contains
more
Protein Protein
+19.4%
Contains
more
Carbs Carbs
+22.7%
Contains
more
Fats Fats
+86.8%
Contains
more
Water Water
+36.7%
Contains
more
Other Other
+350%
Fat Type Comparison
Fat type breakdown side-by-side comparison
2
21%
37%
43%
Saturated fat:
Sat. Fat
1.217 g
Monounsaturated fat:
Mono. Fat
2.178 g
Polyunsaturated fat:
Poly. Fat
2.535 g
1
18%
15%
67%
Saturated fat:
Sat. Fat
2.14 g
Monounsaturated fat:
Mono. Fat
1.695 g
Polyunsaturated fat:
Poly. Fat
7.766 g
Contains
less
Sat. Fat Saturated fat
-43.1%
Contains
more
Mono. Fat Monounsaturated fat
+28.5%
Contains
more
Poly. Fat Polyunsaturated fat
+206.4%