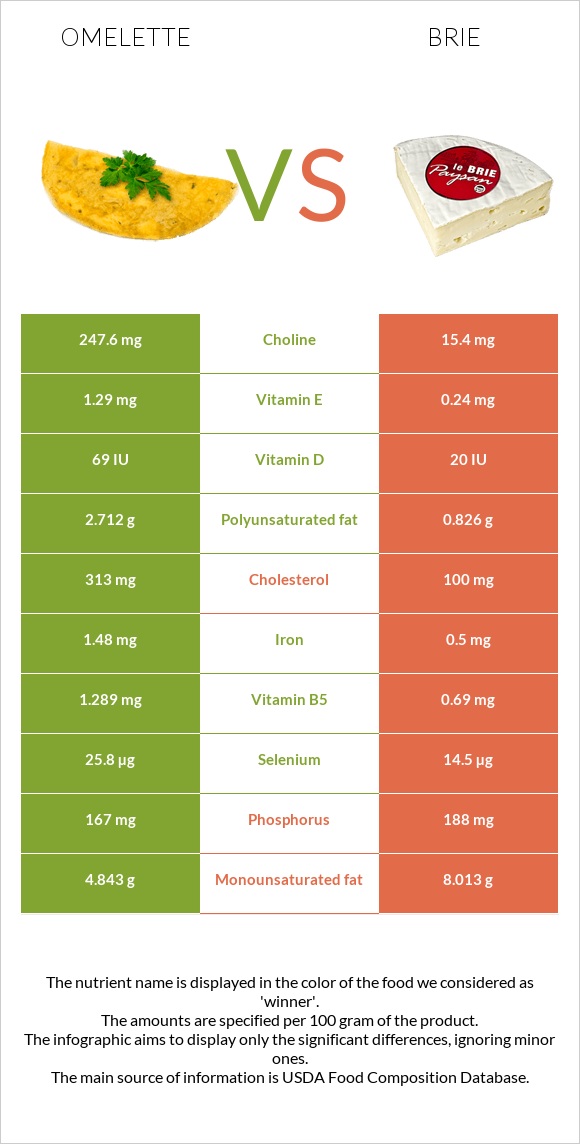
What are the main differences between omelette and brie? Omelette is richer in choline, selenium, iron, and vitamin B5, yet brie is richer in vitamin B12, calcium, and zinc. Omelette's daily need coverage for cholesterol is 71% higher. Omelette has 16 times more choline than brie. Omelette has 247.6mg of choline, while brie has 15.4mg. Brie contains less cholesterol. We used Egg, whole, cooked, omelet and Cheese, brie types in this comparison.
Infographic
Mineral Comparison
Mineral comparison score is based on the number of minerals by which one or the other food is richer. The "coverage" charts below show how much of the daily needs can be covered by 300 grams of the food.
4
100 g
300 g
1 tbsp - 15g 1 large - 61g
Magnesium
Magnesium
Calcium
Calcium
Potassium
Potassium
Iron
Iron
Copper
Copper
Zinc
Zinc
Phosphorus
Phosphorus
Sodium
Sodium
Manganese
Manganese
Selenium
Selenium
7.9%
14%
10%
56%
21%
30%
72%
20%
3.1%
141%
6
100 g
300 g
1 cubic inch - 17g 1 oz - 28.35g 1 package (4.5 oz) - 128g 1 cup, sliced - 144g 1 cup, melted - 240g
Magnesium
Magnesium
Calcium
Calcium
Potassium
Potassium
Iron
Iron
Copper
Copper
Zinc
Zinc
Phosphorus
Phosphorus
Sodium
Sodium
Manganese
Manganese
Selenium
Selenium
14%
55%
13%
19%
6.3%
65%
81%
82%
4.4%
79%
Vitamin Comparison
Vitamin comparison score is based on the number of vitamins by which one or the other food is richer. The "coverage" charts below show how much of the daily needs can be covered by 300 grams of the food.
4
100 g
300 g
1 tbsp - 15g 1 large - 61g
Vitamin C
Vit. C
Vitamin D
Vit. D
Vitamin A
Vit. A
Vitamin E
Vit. E
Vitamin B1
Vit. B1
Vitamin B2
Vit. B2
Vitamin B3
Vit. B3
Vitamin B5
Vit. B5
Vitamin B6
Vit. B6
Vitamin B12
Vit. B12
Vitamin K
Vit. K
Folate
Folate
0%
26%
57%
26%
8.5%
89%
1.2%
77%
33%
95%
11%
29%
6
100 g
300 g
1 cubic inch - 17g 1 oz - 28.35g 1 package (4.5 oz) - 128g 1 cup, sliced - 144g 1 cup, melted - 240g
Vitamin C
Vit. C
Vitamin D
Vit. D
Vitamin A
Vit. A
Vitamin E
Vit. E
Vitamin B1
Vit. B1
Vitamin B2
Vit. B2
Vitamin B3
Vit. B3
Vitamin B5
Vit. B5
Vitamin B6
Vit. B6
Vitamin B12
Vit. B12
Vitamin K
Vit. K
Folate
Folate
0%
7.5%
58%
4.8%
18%
120%
7.1%
41%
54%
206%
5.8%
49%
All nutrients comparison - raw data values
Nutrient
DV% diff.
Cholesterol
313mg
100mg
71%
Saturated fat
3.319g
17.41g
64%
Choline
247.6mg
15.4mg
42%
Vitamin B12
0.76µg
1.65µg
37%
Fats
11.66g
27.68g
25%
Sodium
155mg
629mg
21%
Selenium
25.8µg
14.5µg
21%
Protein
10.57g
20.75g
20%
Calcium
48mg
184mg
14%
Polyunsaturated fat
2.712g
0.826g
13%
Iron
1.48mg
0.5mg
12%
Zinc
1.09mg
2.38mg
12%
Vitamin B5
1.289mg
0.69mg
12%
Vitamin B2
0.386mg
0.52mg
10%
Calories
154kcal
334kcal
9%
Monounsaturated fat
4.843g
8.013g
8%
Vitamin E
1.29mg
0.24mg
7%
Vitamin B6
0.143mg
0.235mg
7%
Folate
39µg
65µg
7%
Vitamin D*
69 IU
20 IU
6%
Vitamin D
1.7µg
0.5µg
6%
Copper
0.063mg
0.019mg
5%
Phosphorus
167mg
188mg
3%
Vitamin B1
0.034mg
0.07mg
3%
Magnesium
11mg
20mg
2%
Vitamin B3
0.064mg
0.38mg
2%
Vitamin K
4.5µg
2.3µg
2%
Potassium
117mg
152mg
1%
Protein per 100 calories
6.9g
6.2g
N/A
Calories per 10 g protein
146kcal
161kcal
N/A
Weight per 100 calories
65g
30g
N/A
Unsaturated / Saturated Fat ratio
2.3
0.51
N/A
Net carbs
0.64g
0.45g
N/A
Carbs
0.64g
0.45g
0%
Sugar
0.31g
0.45g
N/A
Vitamin A
172µg
174µg
0%
Manganese
0.024mg
0.034mg
0%
Trans fat
0.709g
N/A
Tryptophan
0.14mg
0.322mg
0%
Threonine
0.467mg
0.751mg
0%
Isoleucine
0.565mg
1.015mg
0%
Leucine
0.913mg
1.929mg
0%
Lysine
0.767mg
1.851mg
0%
Methionine
0.319mg
0.592mg
0%
Phenylalanine
0.572mg
1.158mg
0%
Valine
0.722mg
1.34mg
0%
Histidine
0.26mg
0.716mg
0%
Omega-3 - DHA
0.049g
0g
N/A
Omega-3 - DPA
0.006g
0g
N/A
Omega-6 - Eicosadienoic acid
0.015g
N/A
Macronutrient Comparison
Macronutrient breakdown side-by-side comparison
2
11%
12%
76%
Protein:
10.57 g
Fats:
11.66 g
Carbs:
0.64 g
Water:
76.13 g
Other:
1 g
3
21%
28%
48%
3%
Protein:
20.75 g
Fats:
27.68 g
Carbs:
0.45 g
Water:
48.42 g
Other:
2.7 g
Contains
more
Carbs Carbs
+42.2%
Contains
more
Water Water
+57.2%
Contains
more
Protein Protein
+96.3%
Contains
more
Fats Fats
+137.4%
Contains
more
Other Other
+170%
Fat Type Comparison
Fat type breakdown side-by-side comparison
2
31%
45%
25%
Saturated fat:
Sat. Fat
3.319 g
Monounsaturated fat:
Mono. Fat
4.843 g
Polyunsaturated fat:
Poly. Fat
2.712 g
1
66%
31%
3%
Saturated fat:
Sat. Fat
17.41 g
Monounsaturated fat:
Mono. Fat
8.013 g
Polyunsaturated fat:
Poly. Fat
0.826 g
Contains
less
Sat. Fat Saturated fat
-80.9%
Contains
more
Poly. Fat Polyunsaturated fat
+228.3%
Contains
more
Mono. Fat Monounsaturated fat
+65.5%