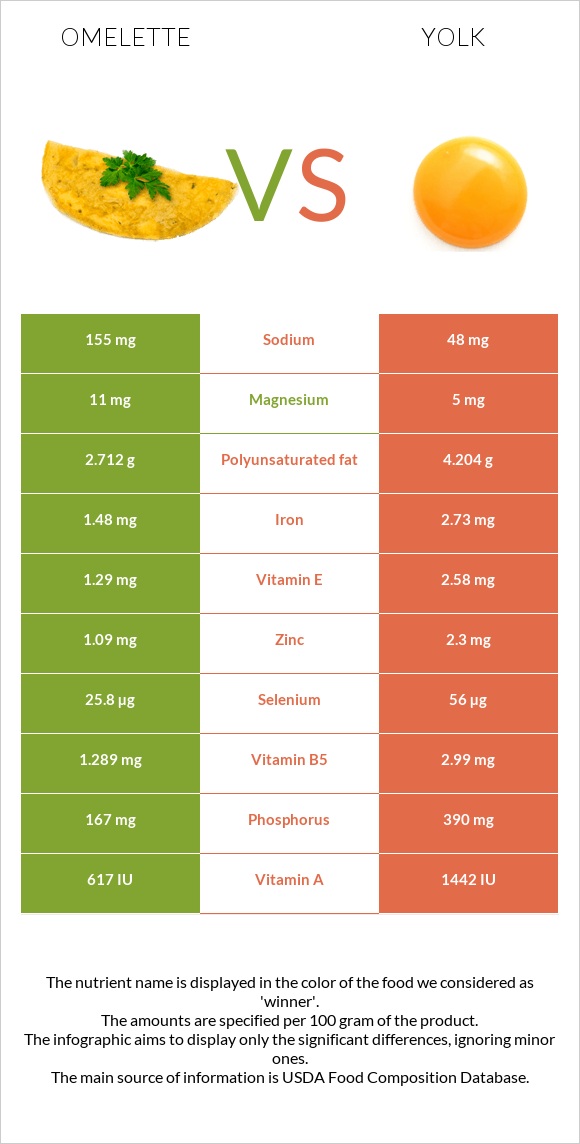
A recap on the differences between omelette and yolk Omelette has less choline, selenium, vitamin B12, vitamin B5, phosphorus, folate, vitamin D* and vitamin A. Yolk covers your daily cholesterol needs 257% more than omelette. Omelette has less saturated fat. Food varieties used in this article are Egg, whole, cooked, omelet and Egg, yolk, raw, fresh .
Infographic
Mineral Comparison
Mineral comparison score is based on the number of minerals by which one or the other food is richer. The "coverage" charts below show how much of the daily needs can be covered by 300 grams of the food.
1
100 g
300 g
1 tbsp - 15g 1 large - 61g
Magnesium
Magnesium
Calcium
Calcium
Potassium
Potassium
Iron
Iron
Copper
Copper
Zinc
Zinc
Phosphorus
Phosphorus
Sodium
Sodium
Manganese
Manganese
Selenium
Selenium
7.9%
14%
10%
56%
21%
30%
72%
20%
3.1%
141%
8
100 g
300 g
1 large - 17g 1 cup - 243g
Magnesium
Magnesium
Calcium
Calcium
Potassium
Potassium
Iron
Iron
Copper
Copper
Zinc
Zinc
Phosphorus
Phosphorus
Sodium
Sodium
Manganese
Manganese
Selenium
Selenium
3.6%
39%
9.6%
102%
26%
63%
167%
6.3%
7.2%
305%
Vitamin Comparison
Vitamin comparison score is based on the number of vitamins by which one or the other food is richer. The "coverage" charts below show how much of the daily needs can be covered by 300 grams of the food.
2
100 g
300 g
1 tbsp - 15g 1 large - 61g
Vitamin C
Vit. C
Vitamin D
Vit. D
Vitamin A
Vit. A
Vitamin E
Vit. E
Vitamin B1
Vit. B1
Vitamin B2
Vit. B2
Vitamin B3
Vit. B3
Vitamin B5
Vit. B5
Vitamin B6
Vit. B6
Vitamin B12
Vit. B12
Vitamin K
Vit. K
Folate
Folate
0%
26%
57%
26%
8.5%
89%
1.2%
77%
33%
95%
11%
29%
9
100 g
300 g
1 large - 17g 1 cup - 243g
Vitamin C
Vit. C
Vitamin D
Vit. D
Vitamin A
Vit. A
Vitamin E
Vit. E
Vitamin B1
Vit. B1
Vitamin B2
Vit. B2
Vitamin B3
Vit. B3
Vitamin B5
Vit. B5
Vitamin B6
Vit. B6
Vitamin B12
Vit. B12
Vitamin K
Vit. K
Folate
Folate
0%
81%
127%
52%
44%
122%
0.45%
179%
81%
244%
1.8%
110%
All nutrients comparison - raw data values
Nutrient
DV% diff.
Cholesterol
313mg
1085mg
257%
Choline
247.6mg
820.2mg
104%
Selenium
25.8µg
56µg
55%
Vitamin B12
0.76µg
1.95µg
50%
Vitamin B5
1.289mg
2.99mg
34%
Phosphorus
167mg
390mg
32%
Saturated fat
3.319g
9.551g
28%
Folate
39µg
146µg
27%
Fats
11.66g
26.54g
23%
Vitamin A
172µg
381µg
23%
Vitamin D*
69 IU
218 IU
19%
Vitamin D
1.7µg
5.4µg
19%
Monounsaturated fat
4.843g
11.738g
17%
Iron
1.48mg
2.73mg
16%
Vitamin B6
0.143mg
0.35mg
16%
Vitamin B1
0.034mg
0.176mg
12%
Protein
10.57g
15.86g
11%
Zinc
1.09mg
2.3mg
11%
Vitamin B2
0.386mg
0.528mg
11%
Polyunsaturated fat
2.712g
4.204g
10%
Vitamin E
1.29mg
2.58mg
9%
Calories
154kcal
322kcal
8%
Calcium
48mg
129mg
8%
Sodium
155mg
48mg
5%
Vitamin K
4.5µg
0.7µg
3%
Copper
0.063mg
0.077mg
2%
Carbs
0.64g
3.59g
1%
Magnesium
11mg
5mg
1%
Manganese
0.024mg
0.055mg
1%
Protein per 100 calories
6.9g
4.9g
N/A
Calories per 10 g protein
146kcal
203kcal
N/A
Weight per 100 calories
65g
31g
N/A
Unsaturated / Saturated Fat ratio
2.3
1.7
N/A
Net carbs
0.64g
3.59g
N/A
Potassium
117mg
109mg
0%
Sugar
0.31g
0.56g
N/A
Vitamin B3
0.064mg
0.024mg
0%
Trans fat
0.709g
N/A
Tryptophan
0.14mg
0.177mg
0%
Threonine
0.467mg
0.687mg
0%
Isoleucine
0.565mg
0.866mg
0%
Leucine
0.913mg
1.399mg
0%
Lysine
0.767mg
1.217mg
0%
Methionine
0.319mg
0.378mg
0%
Phenylalanine
0.572mg
0.681mg
0%
Valine
0.722mg
0.949mg
0%
Histidine
0.26mg
0.416mg
0%
Fructose
0g
0.07g
0%
Omega-3 - EPA
0g
0.011g
N/A
Omega-3 - DHA
0.049g
0.114g
N/A
Omega-3 - DPA
0.006g
0g
N/A
Omega-6 - Eicosadienoic acid
0.015g
N/A
Macronutrient Comparison
Macronutrient breakdown side-by-side comparison
1
11%
12%
76%
Protein:
10.57 g
Fats:
11.66 g
Carbs:
0.64 g
Water:
76.13 g
Other:
1 g
4
16%
27%
4%
52%
2%
Protein:
15.86 g
Fats:
26.54 g
Carbs:
3.59 g
Water:
52.31 g
Other:
1.7 g
Contains
more
Water Water
+45.5%
Contains
more
Protein Protein
+50%
Contains
more
Fats Fats
+127.6%
Contains
more
Carbs Carbs
+460.9%
Contains
more
Other Other
+70%
Fat Type Comparison
Fat type breakdown side-by-side comparison
1
31%
45%
25%
Saturated fat:
Sat. Fat
3.319 g
Monounsaturated fat:
Mono. Fat
4.843 g
Polyunsaturated fat:
Poly. Fat
2.712 g
2
37%
46%
16%
Saturated fat:
Sat. Fat
9.551 g
Monounsaturated fat:
Mono. Fat
11.738 g
Polyunsaturated fat:
Poly. Fat
4.204 g
Contains
less
Sat. Fat Saturated fat
-65.2%
Contains
more
Mono. Fat Monounsaturated fat
+142.4%
Contains
more
Poly. Fat Polyunsaturated fat
+55%
Carbohydrate type comparison
Carbohydrate type breakdown side-by-side comparison
1
100%
Starch:
0 g
Sucrose:
0 g
Glucose:
0.31 g
Fructose:
0 g
Lactose:
0 g
Maltose:
0 g
Galactose:
0 g
5
13%
34%
13%
13%
13%
13%
Starch:
0 g
Sucrose:
0.07 g
Glucose:
0.18 g
Fructose:
0.07 g
Lactose:
0.07 g
Maltose:
0.07 g
Galactose:
0.07 g
Contains
more
Glucose Glucose
+72.2%
Contains
more
Sucrose Sucrose
+∞%
Contains
more
Fructose Fructose
+∞%
Contains
more
Lactose Lactose
+∞%
Contains
more
Maltose Maltose
+∞%
Contains
more
Galactose Galactose
+∞%