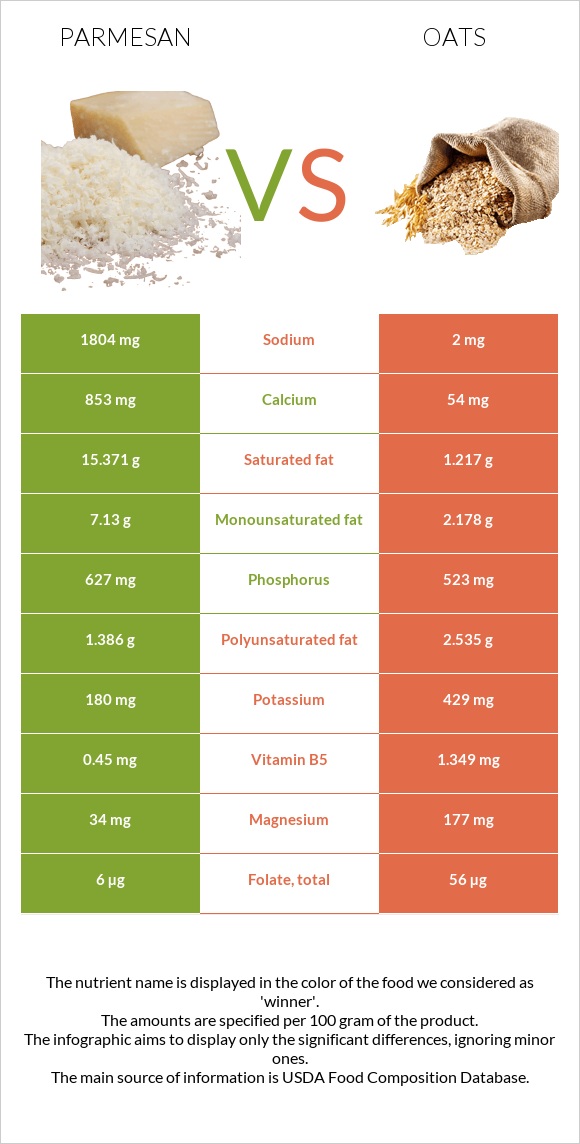
Significant differences between parmesan and oats Parmesan has more calcium and vitamin B12; however, oats are richer in manganese, copper, vitamin B1, iron, fiber, and magnesium. Oats cover your daily manganese needs 211% more than parmesan. Oats contain less sodium. Specific food types used in this comparison are Cheese, parmesan, grated and Oats .
Infographic
Mineral Comparison
Mineral comparison score is based on the number of minerals by which one or the other food is richer. The "coverage" charts below show how much of the daily needs can be covered by 300 grams of the food.
3
100 g
300 g
1 tbsp - 5g 1 oz - 28.35g
Magnesium
Magnesium
Calcium
Calcium
Potassium
Potassium
Iron
Iron
Copper
Copper
Zinc
Zinc
Phosphorus
Phosphorus
Sodium
Sodium
Manganese
Manganese
Selenium
Selenium
24%
256%
16%
18%
13%
115%
269%
235%
9.3%
188%
6
100 g
300 g
1 cup - 156g
Magnesium
Magnesium
Calcium
Calcium
Potassium
Potassium
Iron
Iron
Copper
Copper
Zinc
Zinc
Phosphorus
Phosphorus
Sodium
Sodium
Manganese
Manganese
Selenium
Selenium
126%
16%
38%
177%
209%
108%
224%
0.26%
641%
0%
Vitamin Comparison
Vitamin comparison score is based on the number of vitamins by which one or the other food is richer. The "coverage" charts below show how much of the daily needs can be covered by 300 grams of the food.
6
100 g
300 g
1 tbsp - 5g 1 oz - 28.35g
Vitamin C
Vit. C
Vitamin D
Vit. D
Vitamin A
Vit. A
Vitamin E
Vit. E
Vitamin B1
Vit. B1
Vitamin B2
Vit. B2
Vitamin B3
Vit. B3
Vitamin B5
Vit. B5
Vitamin B6
Vit. B6
Vitamin B12
Vit. B12
Vitamin K
Vit. K
Folate
Folate
0%
7.5%
87%
11%
6.5%
83%
1.5%
27%
19%
175%
4.3%
4.5%
5
100 g
300 g
1 cup - 156g
Vitamin C
Vit. C
Vitamin D
Vit. D
Vitamin A
Vit. A
Vitamin E
Vit. E
Vitamin B1
Vit. B1
Vitamin B2
Vit. B2
Vitamin B3
Vit. B3
Vitamin B5
Vit. B5
Vitamin B6
Vit. B6
Vitamin B12
Vit. B12
Vitamin K
Vit. K
Folate
Folate
0%
0%
0%
0%
191%
32%
18%
81%
27%
0%
0%
42%
All nutrients comparison - raw data values
Nutrient
DV% diff.
Manganese
0.071mg
4.916mg
211%
Calcium
853mg
54mg
80%
Sodium
1804mg
2mg
78%
Copper
0.04mg
0.626mg
65%
Saturated fat
15.371g
1.217g
64%
Selenium
34.4µg
63%
Vitamin B1
0.026mg
0.763mg
61%
Vitamin B12
1.4µg
0µg
58%
Iron
0.49mg
4.72mg
53%
Fiber
0g
10.6g
42%
Magnesium
34mg
177mg
34%
Fats
27.84g
6.9g
32%
Cholesterol
86mg
0mg
29%
Vitamin A
262µg
0µg
29%
Protein
28.42g
16.89g
23%
Vitamin B5
0.45mg
1.349mg
18%
Carbs
13.91g
66.27g
17%
Vitamin B2
0.358mg
0.139mg
17%
Phosphorus
627mg
523mg
15%
Folate
6µg
56µg
13%
Monounsaturated fat
7.13g
2.178g
12%
Polyunsaturated fat
1.386g
2.535g
8%
Potassium
180mg
429mg
7%
Vitamin B3
0.08mg
0.961mg
6%
Vitamin E
0.53mg
4%
Vitamin D*
21 IU
0 IU
3%
Vitamin D
0.5µg
0µg
3%
Vitamin B6
0.081mg
0.119mg
3%
Choline
14.1mg
3%
Calories
420kcal
389kcal
2%
Zinc
4.2mg
3.97mg
2%
Vitamin K
1.7µg
1%
Protein per 100 calories
6.8g
4.3g
N/A
Calories per 10 g protein
148kcal
230kcal
N/A
Weight per 100 calories
24g
26g
N/A
Unsaturated / Saturated Fat ratio
0.55
3.9
N/A
Net carbs
13.91g
55.67g
N/A
Sugar
0.07g
N/A
Trans fat
0.876g
N/A
Tryptophan
0.383mg
0.234mg
0%
Threonine
1.075mg
0.575mg
0%
Isoleucine
1.455mg
0.694mg
0%
Leucine
2.747mg
1.284mg
0%
Lysine
2.201mg
0.701mg
0%
Methionine
0.751mg
0.312mg
0%
Phenylalanine
1.538mg
0.895mg
0%
Valine
1.865mg
0.937mg
0%
Histidine
0.806mg
0.405mg
0%
Omega-3 - ALA
0.102g
N/A
Omega-3 - DPA
0.015g
N/A
Omega-3 - Eicosatrienoic acid
0.002g
N/A
Omega-6 - Gamma-linoleic acid
0.002g
N/A
Omega-6 - Dihomo-gamma-linoleic acid
0.026g
N/A
Omega-6 - Eicosadienoic acid
0.006g
N/A
Omega-6 - Linoleic acid
0.87g
N/A
Macronutrient Comparison
Macronutrient breakdown side-by-side comparison
4
28%
28%
14%
23%
7%
Protein:
28.42 g
Fats:
27.84 g
Carbs:
13.91 g
Water:
22.65 g
Other:
7.18 g
1
17%
7%
66%
8%
2%
Protein:
16.89 g
Fats:
6.9 g
Carbs:
66.27 g
Water:
8.22 g
Other:
1.72 g
Contains
more
Protein Protein
+68.3%
Contains
more
Fats Fats
+303.5%
Contains
more
Water Water
+175.5%
Contains
more
Other Other
+317.4%
Contains
more
Carbs Carbs
+376.4%
Fat Type Comparison
Fat type breakdown side-by-side comparison
1
64%
30%
6%
Saturated fat:
Sat. Fat
15.371 g
Monounsaturated fat:
Mono. Fat
7.13 g
Polyunsaturated fat:
Poly. Fat
1.386 g
2
21%
37%
43%
Saturated fat:
Sat. Fat
1.217 g
Monounsaturated fat:
Mono. Fat
2.178 g
Polyunsaturated fat:
Poly. Fat
2.535 g
Contains
more
Mono. Fat Monounsaturated fat
+227.4%
Contains
less
Sat. Fat Saturated fat
-92.1%
Contains
more
Poly. Fat Polyunsaturated fat
+82.9%