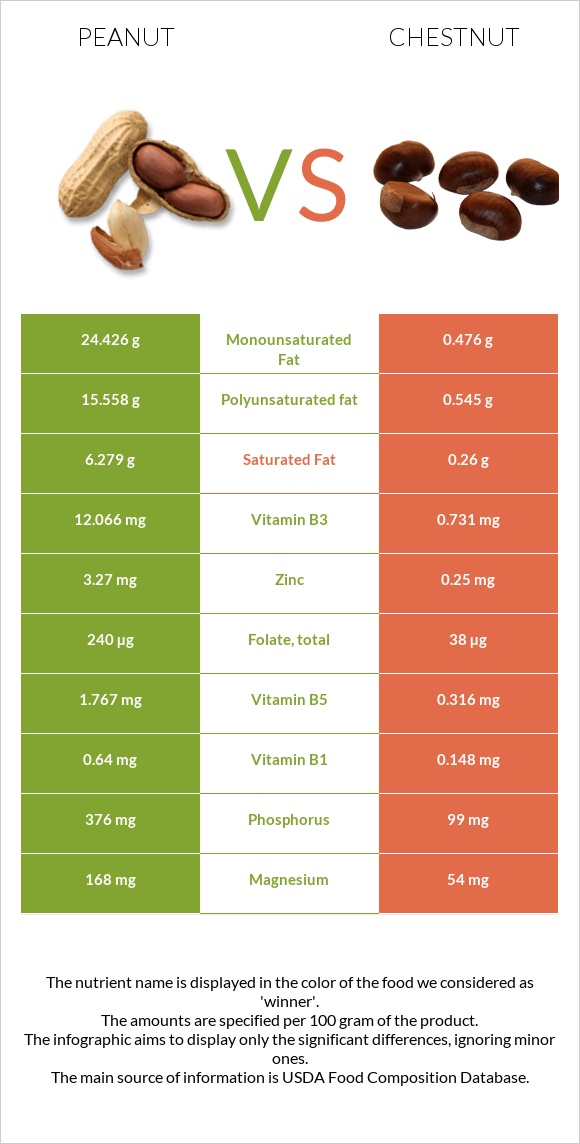
How are peanuts and chestnut different? Peanuts are richer in copper, vitamin B3, folate, manganese, vitamin B1, phosphorus, iron, and vitamin B5, while chestnut is higher in vitamin C. Peanuts cover your daily need for copper, 75% more than chestnut. Peanuts contain 24 times more saturated fat than chestnut. Peanuts contain 6.279g of saturated fat, while chestnut contains 0.26g. Chestnut has a higher glycemic index (54) than peanuts (13). Peanuts, all types, raw and Nuts, chestnuts, european, boiled, and steamed types were used in this article.
Infographic
Mineral Comparison
Mineral comparison score is based on the number of minerals by which one or the other food is richer. The "coverage" charts below show how much of the daily needs can be covered by 300 grams of the food.
9
100 g
300 g
1 oz - 28.35g 1 cup - 146g
Magnesium
Magnesium
Calcium
Calcium
Potassium
Potassium
Iron
Iron
Copper
Copper
Zinc
Zinc
Phosphorus
Phosphorus
Sodium
Sodium
Manganese
Manganese
Selenium
Selenium
120%
28%
62%
172%
381%
89%
161%
2.3%
252%
39%
0
100 g
300 g
1 oz - 28.35g
Magnesium
Magnesium
Calcium
Calcium
Potassium
Potassium
Iron
Iron
Copper
Copper
Zinc
Zinc
Phosphorus
Phosphorus
Sodium
Sodium
Manganese
Manganese
Selenium
Selenium
39%
14%
63%
65%
157%
6.8%
42%
3.5%
111%
0%
Vitamin Comparison
Vitamin comparison score is based on the number of vitamins by which one or the other food is richer. The "coverage" charts below show how much of the daily needs can be covered by 300 grams of the food.
7
100 g
300 g
1 oz - 28.35g 1 cup - 146g
Vitamin C
Vit. C
Vitamin D
Vit. D
Vitamin A
Vit. A
Vitamin E
Vit. E
Vitamin B1
Vit. B1
Vitamin B2
Vit. B2
Vitamin B3
Vit. B3
Vitamin B5
Vit. B5
Vitamin B6
Vit. B6
Vitamin B12
Vit. B12
Vitamin K
Vit. K
Folate
Folate
0%
0%
0%
167%
160%
31%
226%
106%
80%
0%
0%
180%
2
100 g
300 g
1 oz - 28.35g
Vitamin C
Vit. C
Vitamin D
Vit. D
Vitamin A
Vit. A
Vitamin E
Vit. E
Vitamin B1
Vit. B1
Vitamin B2
Vit. B2
Vitamin B3
Vit. B3
Vitamin B5
Vit. B5
Vitamin B6
Vit. B6
Vitamin B12
Vit. B12
Vitamin K
Vit. K
Folate
Folate
89%
0%
0.33%
0%
37%
24%
14%
19%
54%
0%
0%
29%
All nutrients comparison - raw data values
Nutrient
DV% diff.
Polyunsaturated fat
15.558g
0.545g
100%
Copper
1.144mg
0.472mg
75%
Fats
49.24g
1.38g
74%
Vitamin B3
12.066mg
0.731mg
71%
Monounsaturated fat
24.426g
0.476g
60%
Vitamin E
8.33mg
56%
Folate
240µg
38µg
51%
Protein
25.8g
2g
48%
Manganese
1.934mg
0.854mg
47%
Vitamin B1
0.64mg
0.148mg
41%
Phosphorus
376mg
99mg
40%
Iron
4.58mg
1.73mg
36%
Fiber
8.5g
34%
Vitamin C
0mg
26.7mg
30%
Vitamin B5
1.767mg
0.316mg
29%
Magnesium
168mg
54mg
27%
Zinc
3.27mg
0.25mg
27%
Saturated fat
6.279g
0.26g
27%
Calories
567kcal
131kcal
22%
Selenium
7.2µg
13%
Choline
52.5mg
10%
Vitamin B6
0.348mg
0.233mg
9%
Calcium
92mg
46mg
5%
Carbs
16.13g
27.76g
4%
Vitamin B2
0.135mg
0.104mg
2%
Protein per 100 calories
4.6g
1.5g
N/A
Calories per 10 g protein
220kcal
655kcal
N/A
Weight per 100 calories
18g
76g
N/A
Unsaturated / Saturated Fat ratio
6.4
3.9
N/A
Net carbs
7.63g
27.76g
N/A
Potassium
705mg
715mg
0%
Sugar
4.72g
N/A
Sodium
18mg
27mg
0%
Vitamin A
0µg
1µg
0%
Tryptophan
0.25mg
0.022mg
0%
Threonine
0.883mg
0.071mg
0%
Isoleucine
0.907mg
0.079mg
0%
Leucine
1.672mg
0.118mg
0%
Lysine
0.926mg
0.118mg
0%
Methionine
0.317mg
0.047mg
0%
Phenylalanine
1.377mg
0.084mg
0%
Valine
1.082mg
0.112mg
0%
Histidine
0.652mg
0.055mg
0%
Macronutrient Comparison
Macronutrient breakdown side-by-side comparison
3
26%
49%
16%
7%
2%
Protein:
25.8 g
Fats:
49.24 g
Carbs:
16.13 g
Water:
6.5 g
Other:
2.33 g
2
2%
28%
68%
Protein:
2 g
Fats:
1.38 g
Carbs:
27.76 g
Water:
68.15 g
Other:
0.71 g
Contains
more
Protein Protein
+1190%
Contains
more
Fats Fats
+3468.1%
Contains
more
Other Other
+228.2%
Contains
more
Carbs Carbs
+72.1%
Contains
more
Water Water
+948.5%
Fat Type Comparison
Fat type breakdown side-by-side comparison
2
14%
53%
34%
Saturated fat:
Sat. Fat
6.279 g
Monounsaturated fat:
Mono. Fat
24.426 g
Polyunsaturated fat:
Poly. Fat
15.558 g
1
20%
37%
43%
Saturated fat:
Sat. Fat
0.26 g
Monounsaturated fat:
Mono. Fat
0.476 g
Polyunsaturated fat:
Poly. Fat
0.545 g
Contains
more
Mono. Fat Monounsaturated fat
+5031.5%
Contains
more
Poly. Fat Polyunsaturated fat
+2754.7%
Contains
less
Sat. Fat Saturated fat
-95.9%