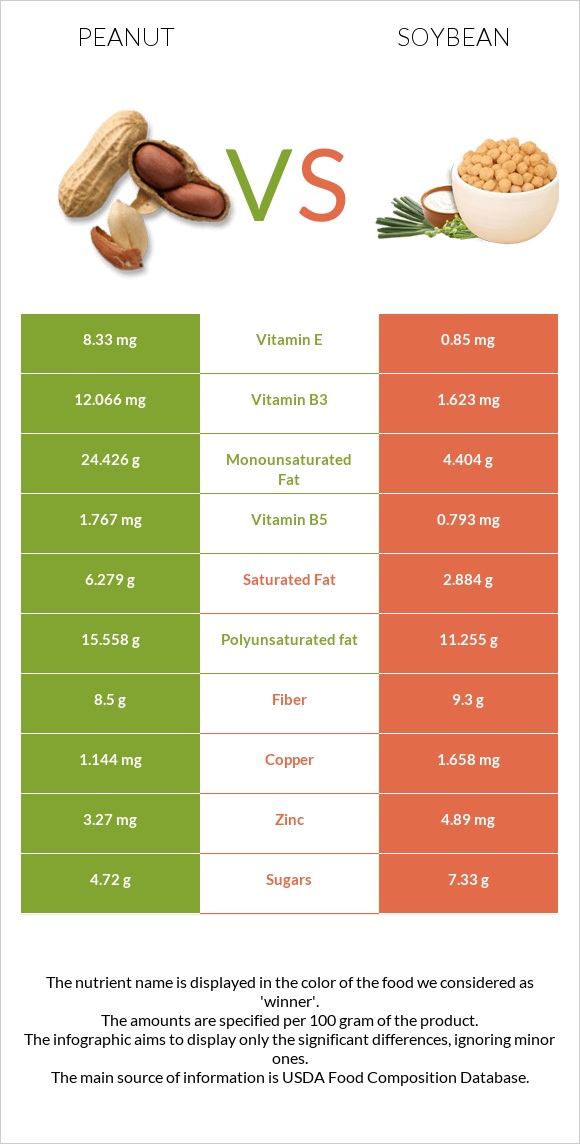
What are the main differences between peanuts and soybeans? Peanuts have more copper, vitamin B3, vitamin E, manganese, folate, vitamin B1, vitamin B5, magnesium, and zinc than soybeans. Peanuts' daily need coverage for copper is 82% higher. Soybeans have 30 times less vitamin B3 than peanuts. Peanuts have 12.066mg of vitamin B3, while soybeans have 0.399mg. Soybeans are lower in saturated fat. We used Peanuts, all types, raw and Soybeans, mature cooked, boiled, without salt types in this comparison.
Infographic
Mineral Comparison
Mineral comparison score is based on the number of minerals by which one or the other food is richer. The "coverage" charts below show how much of the daily needs can be covered by 300 grams of the food.
6
100 g
300 g
1 oz - 28.35g 1 cup - 146g
Magnesium
Magnesium
Calcium
Calcium
Potassium
Potassium
Iron
Iron
Copper
Copper
Zinc
Zinc
Phosphorus
Phosphorus
Sodium
Sodium
Manganese
Manganese
Selenium
Selenium
120%
28%
62%
172%
381%
89%
161%
2.3%
252%
39%
3
100 g
300 g
1 tbsp - 10.7g 1 cup - 172g
Magnesium
Magnesium
Calcium
Calcium
Potassium
Potassium
Iron
Iron
Copper
Copper
Zinc
Zinc
Phosphorus
Phosphorus
Sodium
Sodium
Manganese
Manganese
Selenium
Selenium
61%
31%
45%
193%
136%
31%
105%
0.13%
107%
40%
Vitamin Comparison
Vitamin comparison score is based on the number of vitamins by which one or the other food is richer. The "coverage" charts below show how much of the daily needs can be covered by 300 grams of the food.
6
100 g
300 g
1 oz - 28.35g 1 cup - 146g
Vitamin C
Vit. C
Vitamin D
Vit. D
Vitamin A
Vit. A
Vitamin E
Vit. E
Vitamin B1
Vit. B1
Vitamin B2
Vit. B2
Vitamin B3
Vit. B3
Vitamin B5
Vit. B5
Vitamin B6
Vit. B6
Vitamin B12
Vit. B12
Vitamin K
Vit. K
Folate
Folate
0%
0%
0%
167%
160%
31%
226%
106%
80%
0%
0%
180%
3
100 g
300 g
1 tbsp - 10.7g 1 cup - 172g
Vitamin C
Vit. C
Vitamin D
Vit. D
Vitamin A
Vit. A
Vitamin E
Vit. E
Vitamin B1
Vit. B1
Vitamin B2
Vit. B2
Vitamin B3
Vit. B3
Vitamin B5
Vit. B5
Vitamin B6
Vit. B6
Vitamin B12
Vit. B12
Vitamin K
Vit. K
Folate
Folate
5.7%
0%
0%
7%
39%
66%
7.5%
11%
54%
0%
48%
41%
All nutrients comparison - raw data values
Nutrient
DV% diff.
Copper
1.144mg
0.407mg
82%
Vitamin B3
12.066mg
0.399mg
73%
Polyunsaturated fat
15.558g
5.064g
70%
Fats
49.24g
8.97g
62%
Monounsaturated fat
24.426g
1.981g
56%
Vitamin E
8.33mg
0.35mg
53%
Manganese
1.934mg
0.824mg
48%
Folate
240µg
54µg
47%
Vitamin B1
0.64mg
0.155mg
40%
Vitamin B5
1.767mg
0.179mg
32%
Saturated fat
6.279g
1.297g
23%
Calories
567kcal
172kcal
20%
Magnesium
168mg
86mg
20%
Zinc
3.27mg
1.15mg
19%
Phosphorus
376mg
245mg
19%
Vitamin K
0µg
19.2µg
16%
Protein
25.8g
18.21g
15%
Vitamin B2
0.135mg
0.285mg
12%
Fiber
8.5g
6g
10%
Vitamin B6
0.348mg
0.234mg
9%
Iron
4.58mg
5.14mg
7%
Potassium
705mg
515mg
6%
Carbs
16.13g
8.36g
3%
Vitamin C
0mg
1.7mg
2%
Calcium
92mg
102mg
1%
Sodium
18mg
1mg
1%
Choline
52.5mg
47.5mg
1%
Protein per 100 calories
4.6g
11g
N/A
Calories per 10 g protein
220kcal
94kcal
N/A
Weight per 100 calories
18g
58g
N/A
Unsaturated / Saturated Fat ratio
6.4
5.4
N/A
Net carbs
7.63g
2.36g
N/A
Sugar
4.72g
3g
N/A
Selenium
7.2µg
7.3µg
0%
Tryptophan
0.25mg
0.242mg
0%
Threonine
0.883mg
0.723mg
0%
Isoleucine
0.907mg
0.807mg
0%
Leucine
1.672mg
1.355mg
0%
Lysine
0.926mg
1.108mg
0%
Methionine
0.317mg
0.224mg
0%
Phenylalanine
1.377mg
0.869mg
0%
Valine
1.082mg
0.831mg
0%
Histidine
0.652mg
0.449mg
0%
Macronutrient Comparison
Macronutrient breakdown side-by-side comparison
4
26%
49%
16%
7%
2%
Protein:
25.8 g
Fats:
49.24 g
Carbs:
16.13 g
Water:
6.5 g
Other:
2.33 g
1
18%
9%
8%
63%
2%
Protein:
18.21 g
Fats:
8.97 g
Carbs:
8.36 g
Water:
62.55 g
Other:
1.91 g
Contains
more
Protein Protein
+41.7%
Contains
more
Fats Fats
+448.9%
Contains
more
Carbs Carbs
+92.9%
Contains
more
Other Other
+22%
Contains
more
Water Water
+862.3%
Fat Type Comparison
Fat type breakdown side-by-side comparison
2
14%
53%
34%
Saturated fat:
Sat. Fat
6.279 g
Monounsaturated fat:
Mono. Fat
24.426 g
Polyunsaturated fat:
Poly. Fat
15.558 g
1
16%
24%
61%
Saturated fat:
Sat. Fat
1.297 g
Monounsaturated fat:
Mono. Fat
1.981 g
Polyunsaturated fat:
Poly. Fat
5.064 g
Contains
more
Mono. Fat Monounsaturated fat
+1133%
Contains
more
Poly. Fat Polyunsaturated fat
+207.2%
Contains
less
Sat. Fat Saturated fat
-79.3%