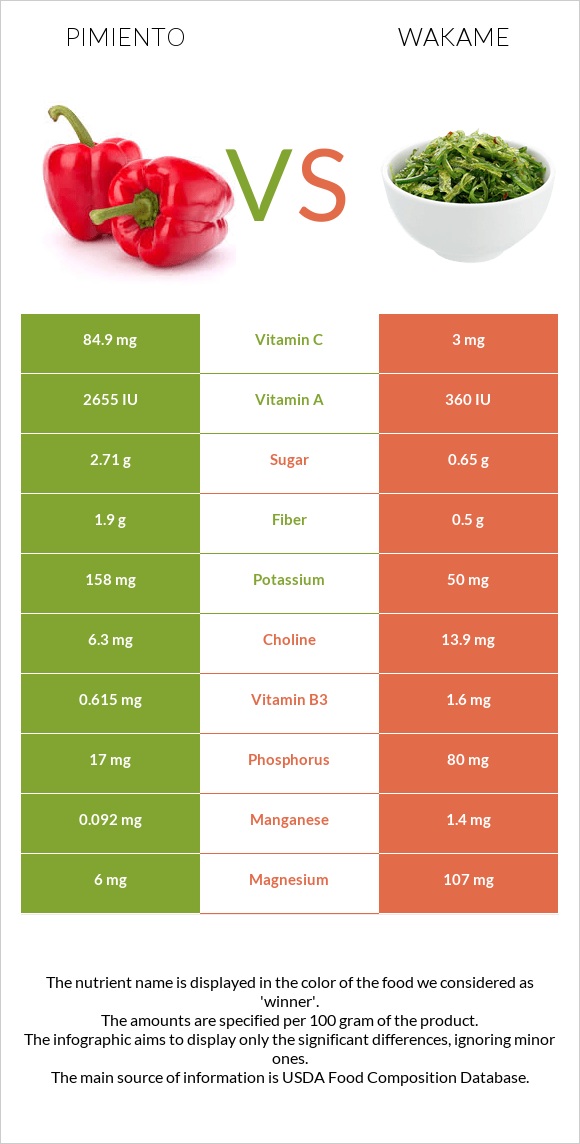
Important differences between pimiento and wakame Pimiento has more vitamin C, vitamin A, and vitamin B6; however, wakame has more manganese, folate, copper, magnesium, calcium, and vitamin B5. Pimiento's daily need coverage for vitamin C is 91% more. Pimiento has 108 times more vitamin B6 than wakame. Pimiento has 0.215mg of vitamin B6, while wakame has 0.002mg. Pimiento is lower in sodium. The food varieties used in the comparison are Pimento, canned and Seaweed, wakame, raw .
Infographic
Mineral Comparison
Mineral comparison score is based on the number of minerals by which one or the other food is richer. The "coverage" charts below show how much of the daily needs can be covered by 300 grams of the food.
2
100 g
300 g
1 slice - 1g 1 tbsp - 12g 1 pimiento, whole - 66g 1 cup - 192g
Magnesium
Magnesium
Calcium
Calcium
Potassium
Potassium
Iron
Iron
Copper
Copper
Zinc
Zinc
Phosphorus
Phosphorus
Sodium
Sodium
Manganese
Manganese
Selenium
Selenium
4.3%
1.8%
14%
63%
16%
5.2%
7.3%
1.8%
12%
1.1%
8
100 g
300 g
2 tbsp (1/8 cup) - 10g
Magnesium
Magnesium
Calcium
Calcium
Potassium
Potassium
Iron
Iron
Copper
Copper
Zinc
Zinc
Phosphorus
Phosphorus
Sodium
Sodium
Manganese
Manganese
Selenium
Selenium
76%
45%
4.4%
82%
95%
10%
34%
114%
183%
3.8%
Vitamin Comparison
Vitamin comparison score is based on the number of vitamins by which one or the other food is richer. The "coverage" charts below show how much of the daily needs can be covered by 300 grams of the food.
4
100 g
300 g
1 slice - 1g 1 tbsp - 12g 1 pimiento, whole - 66g 1 cup - 192g
Vitamin C
Vit. C
Vitamin D
Vit. D
Vitamin A
Vit. A
Vitamin E
Vit. E
Vitamin B1
Vit. B1
Vitamin B2
Vit. B2
Vitamin B3
Vit. B3
Vitamin B5
Vit. B5
Vitamin B6
Vit. B6
Vitamin B12
Vit. B12
Vitamin K
Vit. K
Folate
Folate
283%
0%
44%
14%
4.3%
14%
12%
0.6%
50%
0%
21%
4.5%
6
100 g
300 g
2 tbsp (1/8 cup) - 10g
Vitamin C
Vit. C
Vitamin D
Vit. D
Vitamin A
Vit. A
Vitamin E
Vit. E
Vitamin B1
Vit. B1
Vitamin B2
Vit. B2
Vitamin B3
Vit. B3
Vitamin B5
Vit. B5
Vitamin B6
Vit. B6
Vitamin B12
Vit. B12
Vitamin K
Vit. K
Folate
Folate
10%
0%
6%
20%
15%
53%
30%
42%
0.46%
0%
13%
147%
All nutrients comparison - raw data values
Nutrient
DV% diff.
Vitamin C
84.9mg
3mg
91%
Manganese
0.092mg
1.4mg
57%
Folate
6µg
196µg
48%
Sodium
14mg
872mg
37%
Copper
0.049mg
0.284mg
26%
Magnesium
6mg
107mg
24%
Vitamin B6
0.215mg
0.002mg
16%
Calcium
6mg
150mg
14%
Vitamin B5
0.01mg
0.697mg
14%
Vitamin A
133µg
18µg
13%
Vitamin B2
0.06mg
0.23mg
13%
Phosphorus
17mg
80mg
9%
Iron
1.68mg
2.18mg
6%
Fiber
1.9g
0.5g
6%
Vitamin B3
0.615mg
1.6mg
6%
Protein
1.1g
3.03g
4%
Vitamin B1
0.017mg
0.06mg
4%
Potassium
158mg
50mg
3%
Vitamin K
8.3µg
5.3µg
3%
Zinc
0.19mg
0.38mg
2%
Vitamin E
0.69mg
1mg
2%
Calories
23kcal
45kcal
1%
Fats
0.3g
0.64g
1%
Carbs
5.1g
9.14g
1%
Selenium
0.2µg
0.7µg
1%
Choline
6.3mg
13.9mg
1%
Protein per 100 calories
4.8g
6.7g
N/A
Calories per 10 g protein
209kcal
149kcal
N/A
Weight per 100 calories
435g
222g
N/A
Net carbs
3.2g
8.64g
N/A
Sugar
2.71g
0.65g
N/A
Saturated fat
0.045g
0.13g
0%
Monounsaturated fat
0.02g
0.058g
0%
Polyunsaturated fat
0.161g
0.218g
0%
Tryptophan
0.014mg
0.035mg
0%
Threonine
0.04mg
0.165mg
0%
Isoleucine
0.036mg
0.087mg
0%
Leucine
0.058mg
0.257mg
0%
Lysine
0.049mg
0.112mg
0%
Methionine
0.013mg
0.063mg
0%
Phenylalanine
0.034mg
0.112mg
0%
Valine
0.046mg
0.209mg
0%
Histidine
0.022mg
0.015mg
0%
Omega-3 - EPA
0g
0.186g
N/A
Macronutrient Comparison
Macronutrient breakdown side-by-side comparison
1
5%
93%
Protein:
1.1 g
Fats:
0.3 g
Carbs:
5.1 g
Water:
93.1 g
Other:
0.4 g
4
3%
9%
80%
7%
Protein:
3.03 g
Fats:
0.64 g
Carbs:
9.14 g
Water:
79.99 g
Other:
7.2 g
Contains
more
Water Water
+16.4%
Contains
more
Protein Protein
+175.5%
Contains
more
Fats Fats
+113.3%
Contains
more
Carbs Carbs
+79.2%
Contains
more
Other Other
+1700%
Fat Type Comparison
Fat type breakdown side-by-side comparison
1
20%
9%
71%
Saturated fat:
Sat. Fat
0.045 g
Monounsaturated fat:
Mono. Fat
0.02 g
Polyunsaturated fat:
Poly. Fat
0.161 g
2
32%
14%
54%
Saturated fat:
Sat. Fat
0.13 g
Monounsaturated fat:
Mono. Fat
0.058 g
Polyunsaturated fat:
Poly. Fat
0.218 g
Contains
less
Sat. Fat Saturated fat
-65.4%
Contains
more
Mono. Fat Monounsaturated fat
+190%
Contains
more
Poly. Fat Polyunsaturated fat
+35.4%