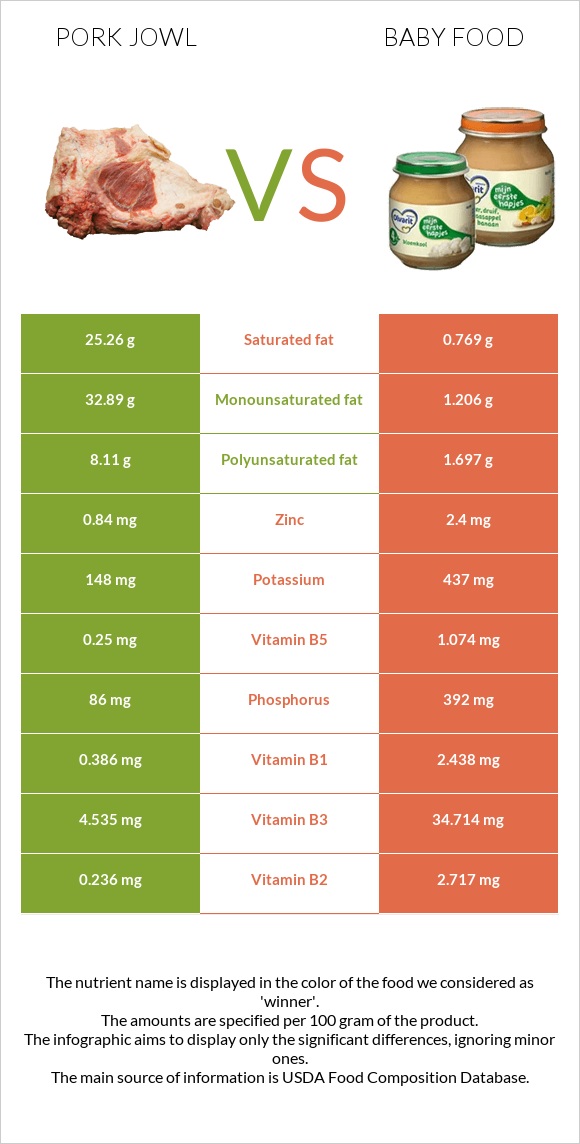
Significant differences between pork jowl and baby food Pork jowl has more vitamin B12; however, baby food is richer in iron, vitamin B2, vitamin B3, vitamin B1, calcium, selenium, phosphorus, and copper. Baby food covers your daily iron needs 589% more than pork jowl. Baby food contains less saturated fat. Baby food has a higher glycemic index. The glycemic index of baby food is 56, while the glycemic index of pork jowl is 0. Specific food types used in this comparison are Pork, fresh, variety meats, and by-products, jowl, raw and Babyfood, cereal, mixed, dry fortified .
Infographic
Mineral Comparison
Mineral comparison score is based on the number of minerals by which one or the other food is richer. The "coverage" charts below show how much of the daily needs can be covered by 300 grams of the food.
1
100 g
300 g
1 oz - 28.35g 4 oz - 113g
Magnesium
Magnesium
Calcium
Calcium
Potassium
Potassium
Iron
Iron
Copper
Copper
Zinc
Zinc
Phosphorus
Phosphorus
Sodium
Sodium
Manganese
Manganese
Selenium
Selenium
2.1%
1.2%
13%
16%
13%
23%
37%
3.3%
0.65%
8.2%
9
100 g
300 g
1 tbsp - 2.5g 0.5 oz - 15g
Magnesium
Magnesium
Calcium
Calcium
Potassium
Potassium
Iron
Iron
Copper
Copper
Zinc
Zinc
Phosphorus
Phosphorus
Sodium
Sodium
Manganese
Manganese
Selenium
Selenium
71%
220%
39%
1781%
111%
65%
168%
0.39%
0%
141%
Vitamin Comparison
Vitamin comparison score is based on the number of vitamins by which one or the other food is richer. The "coverage" charts below show how much of the daily needs can be covered by 300 grams of the food.
2
100 g
300 g
1 oz - 28.35g 4 oz - 113g
Vitamin C
Vit. C
Vitamin D
Vit. D
Vitamin A
Vit. A
Vitamin E
Vit. E
Vitamin B1
Vit. B1
Vitamin B2
Vit. B2
Vitamin B3
Vit. B3
Vitamin B5
Vit. B5
Vitamin B6
Vit. B6
Vitamin B12
Vit. B12
Vitamin K
Vit. K
Folate
Folate
0%
0%
1%
5.8%
97%
54%
85%
15%
21%
103%
0%
0.75%
9
100 g
300 g
1 tbsp - 2.5g 0.5 oz - 15g
Vitamin C
Vit. C
Vitamin D
Vit. D
Vitamin A
Vit. A
Vitamin E
Vit. E
Vitamin B1
Vit. B1
Vitamin B2
Vit. B2
Vitamin B3
Vit. B3
Vitamin B5
Vit. B5
Vitamin B6
Vit. B6
Vitamin B12
Vit. B12
Vitamin K
Vit. K
Folate
Folate
7.7%
0%
0.33%
74%
610%
627%
651%
64%
44%
0%
3.8%
32%
All nutrients comparison - raw data values
Nutrient
DV% diff.
Iron
0.42mg
47.5mg
589%
Vitamin B2
0.236mg
2.717mg
191%
Vitamin B3
4.535mg
34.714mg
189%
Vitamin B1
0.386mg
2.438mg
171%
Saturated fat
25.26g
0.769g
111%
Fats
69.61g
4.4g
100%
Monounsaturated fat
32.89g
1.206g
79%
Calcium
4mg
733mg
73%
Phosphorus
86mg
392mg
44%
Selenium
1.5µg
25.9µg
44%
Polyunsaturated fat
8.11g
1.697g
43%
Vitamin B12
0.82µg
0µg
34%
Copper
0.04mg
0.334mg
33%
Cholesterol
90mg
0mg
30%
Fiber
0g
7.5g
30%
Carbs
0g
73.4g
24%
Magnesium
3mg
100mg
23%
Vitamin E
0.29mg
3.68mg
23%
Vitamin B5
0.25mg
1.074mg
16%
Calories
655kcal
379kcal
14%
Zinc
0.84mg
2.4mg
14%
Protein
6.38g
12.2g
12%
Folate
1µg
43µg
11%
Potassium
148mg
437mg
9%
Vitamin B6
0.09mg
0.189mg
8%
Choline
23.2mg
4%
Vitamin C
0mg
2.3mg
3%
Sodium
25mg
3mg
1%
Vitamin K
1.5µg
1%
Protein per 100 calories
0.97g
3.2g
N/A
Calories per 10 g protein
1027kcal
311kcal
N/A
Weight per 100 calories
15g
26g
N/A
Unsaturated / Saturated Fat ratio
1.6
3.8
N/A
Net carbs
0g
65.9g
N/A
Sugar
0g
0.87g
N/A
Vitamin A
3µg
1µg
0%
Manganese
0.005mg
0%
Tryptophan
0.021mg
0.158mg
0%
Threonine
0.21mg
0.4mg
0%
Isoleucine
0.168mg
0.477mg
0%
Leucine
0.446mg
1.041mg
0%
Lysine
0.528mg
0.404mg
0%
Methionine
0.095mg
0.24mg
0%
Phenylalanine
0.239mg
0.672mg
0%
Valine
0.305mg
0.653mg
0%
Histidine
0.072mg
0.286mg
0%
Macronutrient Comparison
Macronutrient breakdown side-by-side comparison
2
6%
70%
22%
2%
Protein:
6.38 g
Fats:
69.61 g
Carbs:
0 g
Water:
22.19 g
Other:
1.82 g
3
12%
4%
73%
7%
3%
Protein:
12.2 g
Fats:
4.4 g
Carbs:
73.4 g
Water:
6.7 g
Other:
3.3 g
Contains
more
Fats Fats
+1482%
Contains
more
Water Water
+231.2%
Contains
more
Protein Protein
+91.2%
Contains
more
Carbs Carbs
+∞%
Contains
more
Other Other
+81.3%
Fat Type Comparison
Fat type breakdown side-by-side comparison
2
38%
50%
12%
Saturated fat:
Sat. Fat
25.26 g
Monounsaturated fat:
Mono. Fat
32.89 g
Polyunsaturated fat:
Poly. Fat
8.11 g
1
21%
33%
46%
Saturated fat:
Sat. Fat
0.769 g
Monounsaturated fat:
Mono. Fat
1.206 g
Polyunsaturated fat:
Poly. Fat
1.697 g
Contains
more
Mono. Fat Monounsaturated fat
+2627.2%
Contains
more
Poly. Fat Polyunsaturated fat
+377.9%
Contains
less
Sat. Fat Saturated fat
-97%