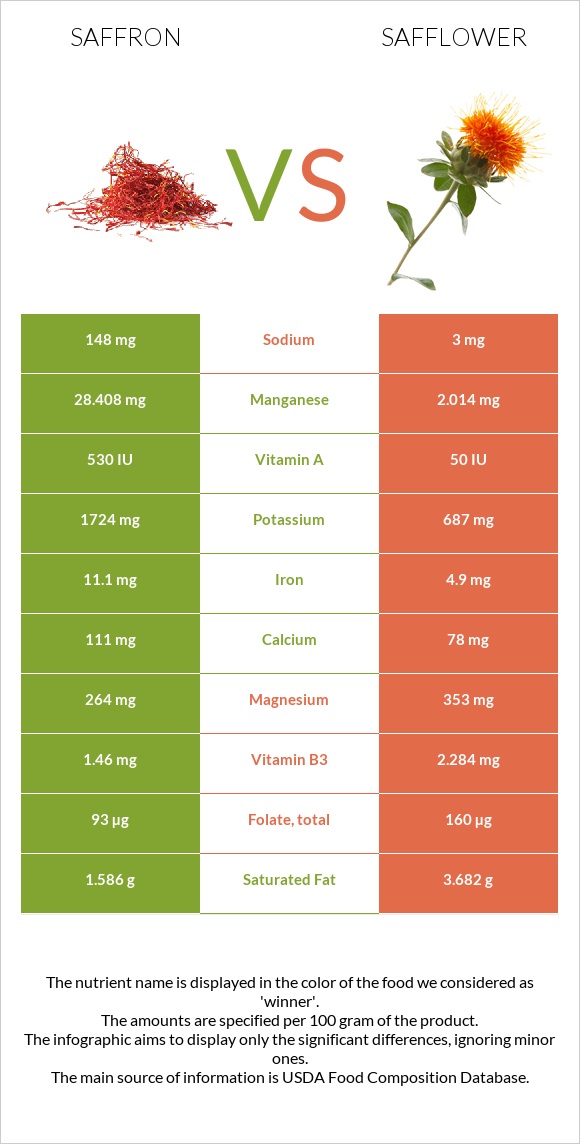
How are saffron and safflower different? Saffron is richer in manganese, vitamin C, iron, and potassium, while safflower is higher in copper, vitamin B1, phosphorus, zinc, magnesium, and folate. Saffron covers your daily need for manganese, 1148% more than safflower. Spices, saffron and Seeds, safflower seed kernels, dried types were used in this article.
Infographic
Mineral Comparison
Mineral comparison score is based on the number of minerals by which one or the other food is richer. The "coverage" charts below show how much of the daily needs can be covered by 300 grams of the food.
5
100 g
300 g
0.25 tsp - 0.5g 1 tbsp - 2.1g
Magnesium
Magnesium
Calcium
Calcium
Potassium
Potassium
Iron
Iron
Copper
Copper
Zinc
Zinc
Phosphorus
Phosphorus
Sodium
Sodium
Manganese
Manganese
Selenium
Selenium
189%
33%
152%
416%
109%
30%
108%
19%
3705%
31%
5
100 g
300 g
1 oz - 28.35g
Magnesium
Magnesium
Calcium
Calcium
Potassium
Potassium
Iron
Iron
Copper
Copper
Zinc
Zinc
Phosphorus
Phosphorus
Sodium
Sodium
Manganese
Manganese
Selenium
Selenium
252%
23%
61%
184%
582%
138%
276%
0.39%
263%
0%
Vitamin Comparison
Vitamin comparison score is based on the number of vitamins by which one or the other food is richer. The "coverage" charts below show how much of the daily needs can be covered by 300 grams of the food.
2
100 g
300 g
0.25 tsp - 0.5g 1 tbsp - 2.1g
Vitamin C
Vit. C
Vitamin D
Vit. D
Vitamin A
Vit. A
Vitamin E
Vit. E
Vitamin B1
Vit. B1
Vitamin B2
Vit. B2
Vitamin B3
Vit. B3
Vitamin B5
Vit. B5
Vitamin B6
Vit. B6
Vitamin B12
Vit. B12
Vitamin K
Vit. K
Folate
Folate
269%
0%
9%
0%
29%
62%
27%
0%
233%
0%
0%
70%
6
100 g
300 g
1 oz - 28.35g
Vitamin C
Vit. C
Vitamin D
Vit. D
Vitamin A
Vit. A
Vitamin E
Vit. E
Vitamin B1
Vit. B1
Vitamin B2
Vit. B2
Vitamin B3
Vit. B3
Vitamin B5
Vit. B5
Vitamin B6
Vit. B6
Vitamin B12
Vit. B12
Vitamin K
Vit. K
Folate
Folate
0%
0%
1%
0%
291%
96%
43%
242%
270%
0%
0%
120%
All nutrients comparison - raw data values
Nutrient
DV% diff.
Manganese
28.408mg
2.014mg
1148%
Polyunsaturated fat
2.067g
28.223g
174%
Copper
0.328mg
1.747mg
158%
Vitamin C
80.8mg
0mg
90%
Vitamin B1
0.115mg
1.163mg
87%
Vitamin B5
4.03mg
81%
Iron
11.1mg
4.9mg
78%
Phosphorus
252mg
644mg
56%
Fats
5.85g
38.45g
50%
Zinc
1.09mg
5.05mg
36%
Potassium
1724mg
687mg
31%
Magnesium
264mg
353mg
21%
Folate
93µg
160µg
17%
Fiber
3.9g
16%
Vitamin B6
1.01mg
1.17mg
12%
Vitamin B2
0.267mg
0.415mg
11%
Monounsaturated fat
0.429g
4.848g
11%
Calories
310kcal
517kcal
10%
Protein
11.43g
16.18g
10%
Carbs
65.37g
34.29g
10%
Selenium
5.6µg
10%
Saturated fat
1.586g
3.682g
10%
Sodium
148mg
3mg
6%
Vitamin B3
1.46mg
2.284mg
5%
Calcium
111mg
78mg
3%
Vitamin A
27µg
3µg
3%
Protein per 100 calories
3.7g
3.1g
N/A
Calories per 10 g protein
271kcal
320kcal
N/A
Weight per 100 calories
32g
19g
N/A
Unsaturated / Saturated Fat ratio
1.6
9
N/A
Net carbs
61.47g
34.29g
N/A
Tryptophan
0.183mg
0%
Threonine
0.586mg
0%
Isoleucine
0.717mg
0%
Leucine
1.154mg
0%
Lysine
0.534mg
0%
Methionine
0.284mg
0%
Phenylalanine
0.806mg
0%
Valine
1.025mg
0%
Histidine
0.452mg
0%
Omega-3 - DPA
0.006g
N/A
Macronutrient Comparison
Macronutrient breakdown side-by-side comparison
2
11%
6%
65%
12%
5%
Protein:
11.43 g
Fats:
5.85 g
Carbs:
65.37 g
Water:
11.9 g
Other:
5.45 g
3
16%
38%
34%
6%
5%
Protein:
16.18 g
Fats:
38.45 g
Carbs:
34.29 g
Water:
5.62 g
Other:
5.46 g
Contains
more
Carbs Carbs
+90.6%
Contains
more
Water Water
+111.7%
Contains
more
Protein Protein
+41.6%
Contains
more
Fats Fats
+557.3%
Fat Type Comparison
Fat type breakdown side-by-side comparison
1
39%
11%
51%
Saturated fat:
Sat. Fat
1.586 g
Monounsaturated fat:
Mono. Fat
0.429 g
Polyunsaturated fat:
Poly. Fat
2.067 g
2
10%
13%
77%
Saturated fat:
Sat. Fat
3.682 g
Monounsaturated fat:
Mono. Fat
4.848 g
Polyunsaturated fat:
Poly. Fat
28.223 g
Contains
less
Sat. Fat Saturated fat
-56.9%
Contains
more
Mono. Fat Monounsaturated fat
+1030.1%
Contains
more
Poly. Fat Polyunsaturated fat
+1265.4%