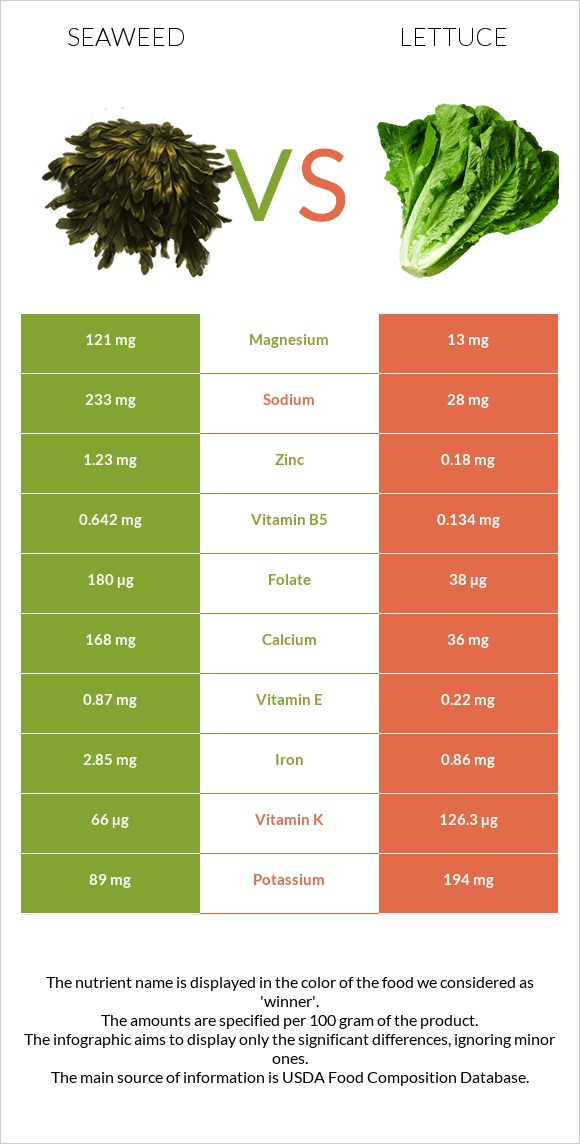
How are seaweed and lettuce different? Seaweed is richer in folate, magnesium, iron, calcium, copper, vitamin B5, and zinc, while lettuce is higher in vitamin A and vitamin K. Lettuce covers your daily need for vitamin A, 146% more than seaweed. Seaweed contains 9 times more magnesium than lettuce. Seaweed contains 121mg of magnesium, while lettuce contains 13mg. Lettuce is lower in sodium. Seaweed, kelp, raw and Lettuce, green leaf, raw types were used in this article.
Infographic
Mineral Comparison
Mineral comparison score is based on the number of minerals by which one or the other food is richer. The "coverage" charts below show how much of the daily needs can be covered by 300 grams of the food.
7
100 g
300 g
2 tbsp (1/8 cup) - 10g
Magnesium
Magnesium
Calcium
Calcium
Potassium
Potassium
Iron
Iron
Copper
Copper
Zinc
Zinc
Phosphorus
Phosphorus
Sodium
Sodium
Manganese
Manganese
Selenium
Selenium
86%
50%
7.9%
107%
43%
34%
18%
30%
26%
3.8%
3
100 g
300 g
1 leaf inner - 4.8g 1 leaf outer - 24g 1 cup shredded - 36g 1 head - 360g
Magnesium
Magnesium
Calcium
Calcium
Potassium
Potassium
Iron
Iron
Copper
Copper
Zinc
Zinc
Phosphorus
Phosphorus
Sodium
Sodium
Manganese
Manganese
Selenium
Selenium
9.3%
11%
17%
32%
9.7%
4.9%
12%
3.7%
33%
3.3%
Vitamin Comparison
Vitamin comparison score is based on the number of vitamins by which one or the other food is richer. The "coverage" charts below show how much of the daily needs can be covered by 300 grams of the food.
5
100 g
300 g
2 tbsp (1/8 cup) - 10g
Vitamin C
Vit. C
Vitamin D
Vit. D
Vitamin A
Vit. A
Vitamin E
Vit. E
Vitamin B1
Vit. B1
Vitamin B2
Vit. B2
Vitamin B3
Vit. B3
Vitamin B5
Vit. B5
Vitamin B6
Vit. B6
Vitamin B12
Vit. B12
Vitamin K
Vit. K
Folate
Folate
10%
0%
2%
17%
13%
35%
8.8%
39%
0.46%
0%
165%
135%
5
100 g
300 g
1 leaf inner - 4.8g 1 leaf outer - 24g 1 cup shredded - 36g 1 head - 360g
Vitamin C
Vit. C
Vitamin D
Vit. D
Vitamin A
Vit. A
Vitamin E
Vit. E
Vitamin B1
Vit. B1
Vitamin B2
Vit. B2
Vitamin B3
Vit. B3
Vitamin B5
Vit. B5
Vitamin B6
Vit. B6
Vitamin B12
Vit. B12
Vitamin K
Vit. K
Folate
Folate
31%
0%
123%
4.4%
18%
18%
7%
8%
21%
0%
316%
29%
All nutrients comparison - raw data values
Nutrient
DV% diff.
Vitamin K
66µg
126.3µg
50%
Vitamin A
6µg
370µg
40%
Folate
180µg
38µg
36%
Magnesium
121mg
13mg
26%
Iron
2.85mg
0.86mg
25%
Calcium
168mg
36mg
13%
Copper
0.13mg
0.029mg
11%
Zinc
1.23mg
0.18mg
10%
Vitamin B5
0.642mg
0.134mg
10%
Sodium
233mg
28mg
9%
Vitamin C
3mg
9.2mg
7%
Vitamin B6
0.002mg
0.09mg
7%
Vitamin B2
0.15mg
0.08mg
5%
Vitamin E
0.87mg
0.22mg
4%
Potassium
89mg
194mg
3%
Carbs
9.57g
2.87g
2%
Phosphorus
42mg
29mg
2%
Manganese
0.2mg
0.25mg
2%
Vitamin B1
0.05mg
0.07mg
2%
Calories
43kcal
15kcal
1%
Protein
1.68g
1.36g
1%
Fats
0.56g
0.15g
1%
Vitamin B3
0.47mg
0.375mg
1%
Saturated fat
0.247g
0.02g
1%
Fructose
0.43g
1%
Protein per 100 calories
3.9g
9.1g
N/A
Calories per 10 g protein
256kcal
110kcal
N/A
Weight per 100 calories
233g
667g
N/A
Net carbs
8.27g
1.57g
N/A
Sugar
0.6g
0.78g
N/A
Fiber
1.3g
1.3g
0%
Selenium
0.7µg
0.6µg
0%
Choline
12.8mg
13.6mg
0%
Monounsaturated fat
0.098g
0.006g
0%
Polyunsaturated fat
0.047g
0.082g
0%
Tryptophan
0.048mg
0.009mg
0%
Threonine
0.055mg
0.059mg
0%
Isoleucine
0.076mg
0.084mg
0%
Leucine
0.083mg
0.079mg
0%
Lysine
0.082mg
0.084mg
0%
Methionine
0.025mg
0.016mg
0%
Phenylalanine
0.043mg
0.055mg
0%
Valine
0.072mg
0.07mg
0%
Histidine
0.024mg
0.022mg
0%
Omega-3 - EPA
0.004g
0g
N/A
Macronutrient Comparison
Macronutrient breakdown side-by-side comparison
4
2%
10%
82%
7%
Protein:
1.68 g
Fats:
0.56 g
Carbs:
9.57 g
Water:
81.58 g
Other:
6.61 g
1
3%
95%
Protein:
1.36 g
Fats:
0.15 g
Carbs:
2.87 g
Water:
94.98 g
Other:
0.64 g
Contains
more
Protein Protein
+23.5%
Contains
more
Fats Fats
+273.3%
Contains
more
Carbs Carbs
+233.4%
Contains
more
Other Other
+932.8%
Contains
more
Water Water
+16.4%
Fat Type Comparison
Fat type breakdown side-by-side comparison
1
63%
25%
12%
Saturated fat:
Sat. Fat
0.247 g
Monounsaturated fat:
Mono. Fat
0.098 g
Polyunsaturated fat:
Poly. Fat
0.047 g
2
19%
6%
76%
Saturated fat:
Sat. Fat
0.02 g
Monounsaturated fat:
Mono. Fat
0.006 g
Polyunsaturated fat:
Poly. Fat
0.082 g
Contains
more
Mono. Fat Monounsaturated fat
+1533.3%
Contains
less
Sat. Fat Saturated fat
-91.9%
Contains
more
Poly. Fat Polyunsaturated fat
+74.5%