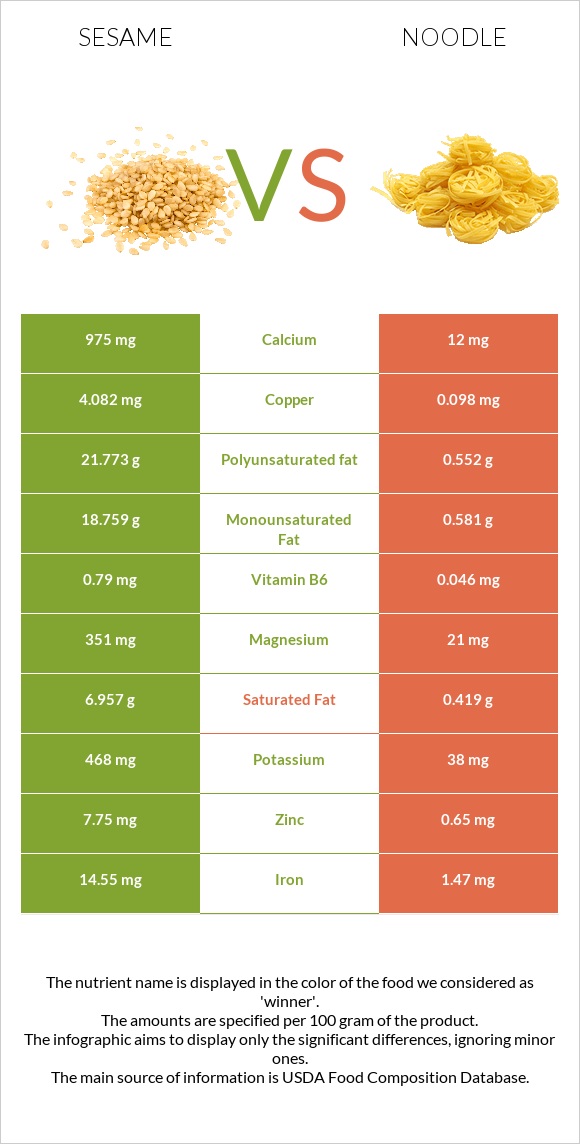
Summary of differences between sesame and noodles The amount of copper, iron, calcium, manganese, phosphorus, magnesium, zinc, vitamin B6, fiber, and vitamin B1 in sesame is higher than in noodles. Sesame covers your daily need for copper, 443% more than noodles. Sesame contains 81 times more calcium than noodles. While sesame contains 975mg of calcium, noodles contains only 12mg. These are the specific foods used in this comparison Seeds, sesame seeds, whole, dried and Noodles, egg, enriched, cooked .
Infographic
Mineral Comparison
Mineral comparison score is based on the number of minerals by which one or the other food is richer. The "coverage" charts below show how much of the daily needs can be covered by 300 grams of the food.
9
100 g
300 g
1 tbsp - 9g 1 cup - 144g
Magnesium
Magnesium
Calcium
Calcium
Potassium
Potassium
Iron
Iron
Copper
Copper
Zinc
Zinc
Phosphorus
Phosphorus
Sodium
Sodium
Manganese
Manganese
Selenium
Selenium
251%
293%
41%
546%
1361%
211%
270%
1.4%
321%
188%
1
100 g
300 g
1 cup - 160g
Magnesium
Magnesium
Calcium
Calcium
Potassium
Potassium
Iron
Iron
Copper
Copper
Zinc
Zinc
Phosphorus
Phosphorus
Sodium
Sodium
Manganese
Manganese
Selenium
Selenium
15%
3.6%
3.4%
55%
33%
18%
33%
0.65%
41%
130%
Vitamin Comparison
Vitamin comparison score is based on the number of vitamins by which one or the other food is richer. The "coverage" charts below show how much of the daily needs can be covered by 300 grams of the food.
6
100 g
300 g
1 tbsp - 9g 1 cup - 144g
Vitamin C
Vit. C
Vitamin D
Vit. D
Vitamin A
Vit. A
Vitamin E
Vit. E
Vitamin B1
Vit. B1
Vitamin B2
Vit. B2
Vitamin B3
Vit. B3
Vitamin B5
Vit. B5
Vitamin B6
Vit. B6
Vitamin B12
Vit. B12
Vitamin K
Vit. K
Folate
Folate
0%
0%
0%
5%
198%
57%
85%
3%
182%
0%
0%
73%
4
100 g
300 g
1 cup - 160g
Vitamin C
Vit. C
Vitamin D
Vit. D
Vitamin A
Vit. A
Vitamin E
Vit. E
Vitamin B1
Vit. B1
Vitamin B2
Vit. B2
Vitamin B3
Vit. B3
Vitamin B5
Vit. B5
Vitamin B6
Vit. B6
Vitamin B12
Vit. B12
Vitamin K
Vit. K
Folate
Folate
0%
1.5%
2%
3.4%
72%
31%
39%
16%
11%
11%
0%
63%
All nutrients comparison - raw data values
Nutrient
DV% diff.
Copper
4.082mg
0.098mg
443%
Iron
14.55mg
1.47mg
164%
Polyunsaturated fat
21.773g
0.552g
141%
Calcium
975mg
12mg
96%
Manganese
2.46mg
0.315mg
93%
Magnesium
351mg
21mg
79%
Phosphorus
629mg
76mg
79%
Fats
49.67g
2.07g
73%
Zinc
7.75mg
0.65mg
65%
Vitamin B6
0.79mg
0.046mg
57%
Monounsaturated fat
18.759g
0.581g
45%
Fiber
11.8g
1.2g
42%
Vitamin B1
0.791mg
0.289mg
42%
Saturated fat
6.957g
0.419g
30%
Protein
17.73g
4.54g
26%
Calories
573kcal
138kcal
22%
Selenium
34.4µg
23.9µg
19%
Vitamin B3
4.515mg
2.077mg
15%
Potassium
468mg
38mg
13%
Cholesterol
0mg
29mg
10%
Vitamin B2
0.247mg
0.136mg
9%
Vitamin B5
0.05mg
0.263mg
4%
Vitamin B12
0µg
0.09µg
4%
Folate
97µg
84µg
3%
Carbs
23.45g
25.16g
1%
Vitamin D*
0 IU
4 IU
1%
Vitamin D
0µg
0.1µg
1%
Vitamin A
0µg
6µg
1%
Vitamin E
0.25mg
0.17mg
1%
Protein per 100 calories
3.1g
3.3g
N/A
Calories per 10 g protein
323kcal
304kcal
N/A
Weight per 100 calories
17g
72g
N/A
Unsaturated / Saturated Fat ratio
5.8
2.7
N/A
Net carbs
11.65g
23.96g
N/A
Sugar
0.3g
0.4g
N/A
Sodium
11mg
5mg
0%
Trans fat
0.029g
N/A
Choline
25.6mg
25.7mg
0%
Tryptophan
0.388mg
0.043mg
0%
Threonine
0.736mg
0.138mg
0%
Isoleucine
0.763mg
0.19mg
0%
Leucine
1.358mg
0.365mg
0%
Lysine
0.569mg
0.137mg
0%
Methionine
0.586mg
0.086mg
0%
Phenylalanine
0.94mg
0.24mg
0%
Valine
0.99mg
0.22mg
0%
Histidine
0.522mg
0.121mg
0%
Macronutrient Comparison
Macronutrient breakdown side-by-side comparison
3
18%
50%
23%
5%
4%
Protein:
17.73 g
Fats:
49.67 g
Carbs:
23.45 g
Water:
4.69 g
Other:
4.46 g
2
5%
2%
25%
68%
Protein:
4.54 g
Fats:
2.07 g
Carbs:
25.16 g
Water:
67.73 g
Other:
0.5 g
Contains
more
Protein Protein
+290.5%
Contains
more
Fats Fats
+2299.5%
Contains
more
Other Other
+792%
Contains
more
Water Water
+1344.1%
Fat Type Comparison
Fat type breakdown side-by-side comparison
2
15%
40%
46%
Saturated fat:
Sat. Fat
6.957 g
Monounsaturated fat:
Mono. Fat
18.759 g
Polyunsaturated fat:
Poly. Fat
21.773 g
1
27%
37%
36%
Saturated fat:
Sat. Fat
0.419 g
Monounsaturated fat:
Mono. Fat
0.581 g
Polyunsaturated fat:
Poly. Fat
0.552 g
Contains
more
Mono. Fat Monounsaturated fat
+3128.7%
Contains
more
Poly. Fat Polyunsaturated fat
+3844.4%
Contains
less
Sat. Fat Saturated fat
-94%