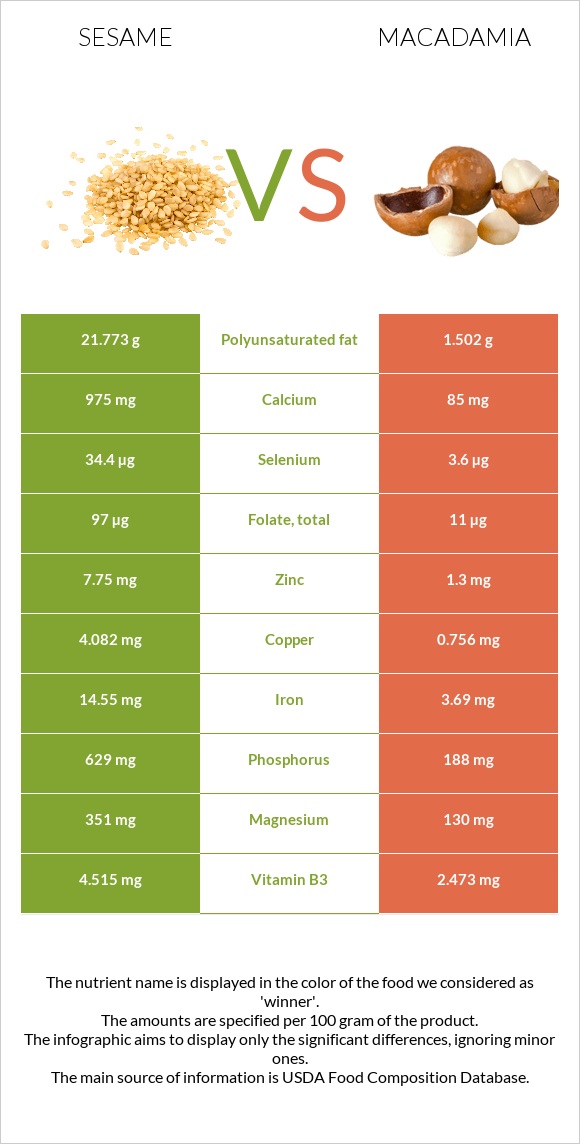
The main differences between sesame and macadamia Sesame has more copper, iron, calcium, phosphorus, zinc, selenium, magnesium, and vitamin B6; however, macadamia has more manganese and vitamin B1. Daily need coverage for copper for sesame is 370% higher. Macadamia has 11 times less calcium than sesame. Sesame has 975mg of calcium, while macadamia has 85mg. Food types used in this article are Seeds, sesame seeds, whole, dried and Nuts, macadamia nuts, raw .
Infographic
Mineral Comparison
Mineral comparison score is based on the number of minerals by which one or the other food is richer. The "coverage" charts below show how much of the daily needs can be covered by 300 grams of the food.
8
100 g
300 g
1 tbsp - 9g 1 cup - 144g
Magnesium
Magnesium
Calcium
Calcium
Potassium
Potassium
Iron
Iron
Copper
Copper
Zinc
Zinc
Phosphorus
Phosphorus
Sodium
Sodium
Manganese
Manganese
Selenium
Selenium
251%
293%
41%
546%
1361%
211%
270%
1.4%
321%
188%
2
100 g
300 g
1 oz (10-12 kernels) - 28.35g 1 cup, whole or halves - 134g
Magnesium
Magnesium
Calcium
Calcium
Potassium
Potassium
Iron
Iron
Copper
Copper
Zinc
Zinc
Phosphorus
Phosphorus
Sodium
Sodium
Manganese
Manganese
Selenium
Selenium
93%
26%
32%
138%
252%
35%
81%
0.65%
539%
20%
Vitamin Comparison
Vitamin comparison score is based on the number of vitamins by which one or the other food is richer. The "coverage" charts below show how much of the daily needs can be covered by 300 grams of the food.
4
100 g
300 g
1 tbsp - 9g 1 cup - 144g
Vitamin C
Vit. C
Vitamin D
Vit. D
Vitamin A
Vit. A
Vitamin E
Vit. E
Vitamin B1
Vit. B1
Vitamin B2
Vit. B2
Vitamin B3
Vit. B3
Vitamin B5
Vit. B5
Vitamin B6
Vit. B6
Vitamin B12
Vit. B12
Vitamin K
Vit. K
Folate
Folate
0%
0%
0%
5%
198%
57%
85%
3%
182%
0%
0%
73%
4
100 g
300 g
1 oz (10-12 kernels) - 28.35g 1 cup, whole or halves - 134g
Vitamin C
Vit. C
Vitamin D
Vit. D
Vitamin A
Vit. A
Vitamin E
Vit. E
Vitamin B1
Vit. B1
Vitamin B2
Vit. B2
Vitamin B3
Vit. B3
Vitamin B5
Vit. B5
Vitamin B6
Vit. B6
Vitamin B12
Vit. B12
Vitamin K
Vit. K
Folate
Folate
4%
0%
0%
11%
299%
37%
46%
45%
63%
0%
0%
8.3%
All nutrients comparison - raw data values
Nutrient
DV% diff.
Copper
4.082mg
0.756mg
370%
Iron
14.55mg
3.69mg
136%
Polyunsaturated fat
21.773g
1.502g
135%
Monounsaturated fat
18.759g
58.877g
100%
Calcium
975mg
85mg
89%
Manganese
2.46mg
4.131mg
73%
Phosphorus
629mg
188mg
63%
Zinc
7.75mg
1.3mg
59%
Selenium
34.4µg
3.6µg
56%
Magnesium
351mg
130mg
53%
Fats
49.67g
75.77g
40%
Vitamin B6
0.79mg
0.275mg
40%
Vitamin B1
0.791mg
1.195mg
34%
Saturated fat
6.957g
12.061g
23%
Folate
97µg
11µg
22%
Protein
17.73g
7.91g
20%
Vitamin B5
0.05mg
0.758mg
14%
Fiber
11.8g
8.6g
13%
Vitamin B3
4.515mg
2.473mg
13%
Calories
573kcal
718kcal
7%
Vitamin B2
0.247mg
0.162mg
7%
Choline
25.6mg
5%
Carbs
23.45g
13.82g
3%
Potassium
468mg
368mg
3%
Vitamin E
0.25mg
0.54mg
2%
Vitamin C
0mg
1.2mg
1%
Protein per 100 calories
3.1g
1.1g
N/A
Calories per 10 g protein
323kcal
908kcal
N/A
Weight per 100 calories
17g
14g
N/A
Unsaturated / Saturated Fat ratio
5.8
5
N/A
Net carbs
11.65g
5.22g
N/A
Sugar
0.3g
4.57g
N/A
Starch
1.05g
0%
Sodium
11mg
5mg
0%
Tryptophan
0.388mg
0.067mg
0%
Threonine
0.736mg
0.37mg
0%
Isoleucine
0.763mg
0.314mg
0%
Leucine
1.358mg
0.602mg
0%
Lysine
0.569mg
0.018mg
0%
Methionine
0.586mg
0.023mg
0%
Phenylalanine
0.94mg
0.665mg
0%
Valine
0.99mg
0.363mg
0%
Histidine
0.522mg
0.195mg
0%
Fructose
0.07g
0%
Macronutrient Comparison
Macronutrient breakdown side-by-side comparison
4
18%
50%
23%
5%
4%
Protein:
17.73 g
Fats:
49.67 g
Carbs:
23.45 g
Water:
4.69 g
Other:
4.46 g
1
8%
76%
14%
Protein:
7.91 g
Fats:
75.77 g
Carbs:
13.82 g
Water:
1.36 g
Other:
1.14 g
Contains
more
Protein Protein
+124.1%
Contains
more
Carbs Carbs
+69.7%
Contains
more
Water Water
+244.9%
Contains
more
Other Other
+291.2%
Contains
more
Fats Fats
+52.5%
Fat Type Comparison
Fat type breakdown side-by-side comparison
2
15%
40%
46%
Saturated fat:
Sat. Fat
6.957 g
Monounsaturated fat:
Mono. Fat
18.759 g
Polyunsaturated fat:
Poly. Fat
21.773 g
1
17%
81%
2%
Saturated fat:
Sat. Fat
12.061 g
Monounsaturated fat:
Mono. Fat
58.877 g
Polyunsaturated fat:
Poly. Fat
1.502 g
Contains
less
Sat. Fat Saturated fat
-42.3%
Contains
more
Poly. Fat Polyunsaturated fat
+1349.6%
Contains
more
Mono. Fat Monounsaturated fat
+213.9%