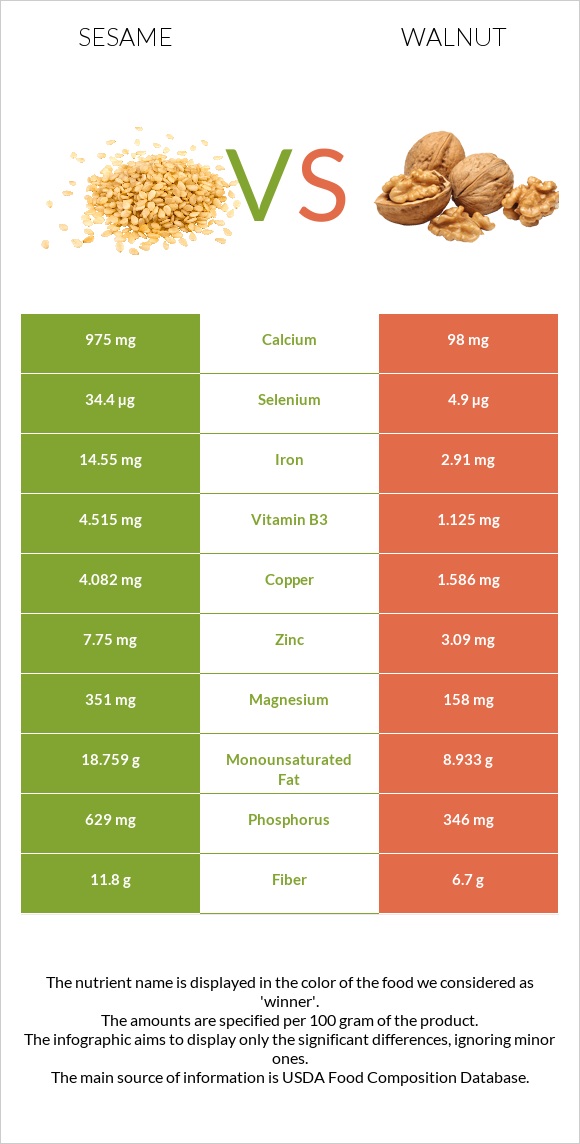
How are sesame and walnut different? Sesame is richer in copper, iron, calcium, selenium, magnesium, zinc, phosphorus, vitamin B1, and vitamin B3, while walnut is higher in manganese. Sesame covers your daily need for copper, 277% more than walnut. Sesame contains 10 times more calcium than walnut. Sesame contains 975mg of calcium, while walnut contains 98mg. Seeds, sesame seeds, whole, dried and Nuts, walnuts, english types were used in this article.
Infographic
Mineral Comparison
Mineral comparison score is based on the number of minerals by which one or the other food is richer. The "coverage" charts below show how much of the daily needs can be covered by 300 grams of the food.
7
100 g
300 g
1 tbsp - 9g 1 cup - 144g
Magnesium
Magnesium
Calcium
Calcium
Potassium
Potassium
Iron
Iron
Copper
Copper
Zinc
Zinc
Phosphorus
Phosphorus
Sodium
Sodium
Manganese
Manganese
Selenium
Selenium
251%
293%
41%
546%
1361%
211%
270%
1.4%
321%
188%
2
100 g
300 g
1 cup, in shell, edible yield (7 nuts) - 28g 1 oz (14 halves) - 28.35g 1 cup, ground - 80g 1 cup, chopped - 117g 1 cup pieces or chips - 120g
Magnesium
Magnesium
Calcium
Calcium
Potassium
Potassium
Iron
Iron
Copper
Copper
Zinc
Zinc
Phosphorus
Phosphorus
Sodium
Sodium
Manganese
Manganese
Selenium
Selenium
113%
29%
39%
109%
529%
84%
148%
0.26%
445%
27%
Vitamin Comparison
Vitamin comparison score is based on the number of vitamins by which one or the other food is richer. The "coverage" charts below show how much of the daily needs can be covered by 300 grams of the food.
4
100 g
300 g
1 tbsp - 9g 1 cup - 144g
Vitamin C
Vit. C
Vitamin D
Vit. D
Vitamin A
Vit. A
Vitamin E
Vit. E
Vitamin B1
Vit. B1
Vitamin B2
Vit. B2
Vitamin B3
Vit. B3
Vitamin B5
Vit. B5
Vitamin B6
Vit. B6
Vitamin B12
Vit. B12
Vitamin K
Vit. K
Folate
Folate
0%
0%
0%
5%
198%
57%
85%
3%
182%
0%
0%
73%
5
100 g
300 g
1 cup, in shell, edible yield (7 nuts) - 28g 1 oz (14 halves) - 28.35g 1 cup, ground - 80g 1 cup, chopped - 117g 1 cup pieces or chips - 120g
Vitamin C
Vit. C
Vitamin D
Vit. D
Vitamin A
Vit. A
Vitamin E
Vit. E
Vitamin B1
Vit. B1
Vitamin B2
Vit. B2
Vitamin B3
Vit. B3
Vitamin B5
Vit. B5
Vitamin B6
Vit. B6
Vitamin B12
Vit. B12
Vitamin K
Vit. K
Folate
Folate
4.3%
0%
0.33%
14%
85%
35%
21%
34%
124%
0%
6.8%
74%
All nutrients comparison - raw data values
Nutrient
DV% diff.
Copper
4.082mg
1.586mg
277%
Polyunsaturated fat
21.773g
47.174g
169%
Iron
14.55mg
2.91mg
146%
Calcium
975mg
98mg
88%
Selenium
34.4µg
4.9µg
54%
Magnesium
351mg
158mg
46%
Zinc
7.75mg
3.09mg
42%
Manganese
2.46mg
3.414mg
41%
Phosphorus
629mg
346mg
40%
Vitamin B1
0.791mg
0.341mg
38%
Monounsaturated fat
18.759g
8.933g
25%
Fats
49.67g
65.21g
24%
Vitamin B3
4.515mg
1.125mg
21%
Fiber
11.8g
6.7g
20%
Vitamin B6
0.79mg
0.537mg
19%
Vitamin B5
0.05mg
0.57mg
10%
Vitamin B2
0.247mg
0.15mg
7%
Protein
17.73g
15.23g
5%
Calories
573kcal
654kcal
4%
Saturated fat
6.957g
6.126g
4%
Carbs
23.45g
13.71g
3%
Vitamin E
0.25mg
0.7mg
3%
Vitamin K
0µg
2.7µg
2%
Choline
25.6mg
39.2mg
2%
Vitamin C
0mg
1.3mg
1%
Potassium
468mg
441mg
1%
Protein per 100 calories
3.1g
2.3g
N/A
Calories per 10 g protein
323kcal
429kcal
N/A
Weight per 100 calories
17g
15g
N/A
Unsaturated / Saturated Fat ratio
5.8
9.2
N/A
Net carbs
11.65g
7.01g
N/A
Sugar
0.3g
2.61g
N/A
Starch
0.06g
0%
Sodium
11mg
2mg
0%
Vitamin A
0µg
1µg
0%
Folate
97µg
98µg
0%
Tryptophan
0.388mg
0.17mg
0%
Threonine
0.736mg
0.596mg
0%
Isoleucine
0.763mg
0.625mg
0%
Leucine
1.358mg
1.17mg
0%
Lysine
0.569mg
0.424mg
0%
Methionine
0.586mg
0.236mg
0%
Phenylalanine
0.94mg
0.711mg
0%
Valine
0.99mg
0.753mg
0%
Histidine
0.522mg
0.391mg
0%
Fructose
0.09g
0%
Macronutrient Comparison
Macronutrient breakdown side-by-side comparison
4
18%
50%
23%
5%
4%
Protein:
17.73 g
Fats:
49.67 g
Carbs:
23.45 g
Water:
4.69 g
Other:
4.46 g
1
15%
65%
14%
4%
2%
Protein:
15.23 g
Fats:
65.21 g
Carbs:
13.71 g
Water:
4.07 g
Other:
1.78 g
Contains
more
Protein Protein
+16.4%
Contains
more
Carbs Carbs
+71%
Contains
more
Water Water
+15.2%
Contains
more
Other Other
+150.6%
Contains
more
Fats Fats
+31.3%
Fat Type Comparison
Fat type breakdown side-by-side comparison
1
15%
40%
46%
Saturated fat:
Sat. Fat
6.957 g
Monounsaturated fat:
Mono. Fat
18.759 g
Polyunsaturated fat:
Poly. Fat
21.773 g
2
10%
14%
76%
Saturated fat:
Sat. Fat
6.126 g
Monounsaturated fat:
Mono. Fat
8.933 g
Polyunsaturated fat:
Poly. Fat
47.174 g
Contains
more
Mono. Fat Monounsaturated fat
+110%
Contains
less
Sat. Fat Saturated fat
-11.9%
Contains
more
Poly. Fat Polyunsaturated fat
+116.7%