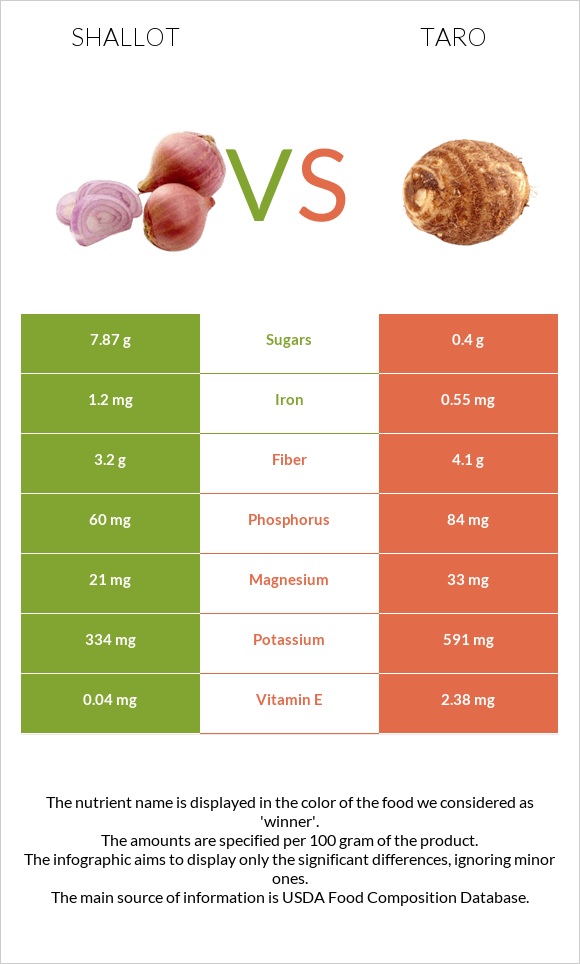
A recap on the differences between shallots and taro Shallots are higher in iron, yet taro is higher in vitamin E, copper, and potassium. Taro covers your daily vitamin E needs 16% more than shallots. Shallots contain 20 times more sugar than taro. While shallots contain 7.87g of sugar, taro contains only 0.4g. The glycemic index of shallots is lower. Food varieties used in this article are Shallots, raw and Taro, raw .
Infographic
Mineral Comparison
Mineral comparison score is based on the number of minerals by which one or the other food is richer. The "coverage" charts below show how much of the daily needs can be covered by 300 grams of the food.
3
100 g
300 g
1 tbsp chopped - 10g
Magnesium
Magnesium
Calcium
Calcium
Potassium
Potassium
Iron
Iron
Copper
Copper
Zinc
Zinc
Phosphorus
Phosphorus
Sodium
Sodium
Manganese
Manganese
Selenium
Selenium
15%
11%
29%
45%
29%
11%
26%
1.6%
38%
6.5%
6
100 g
300 g
1 cup, sliced - 104g
Magnesium
Magnesium
Calcium
Calcium
Potassium
Potassium
Iron
Iron
Copper
Copper
Zinc
Zinc
Phosphorus
Phosphorus
Sodium
Sodium
Manganese
Manganese
Selenium
Selenium
24%
13%
52%
21%
57%
6.3%
36%
1.4%
50%
3.8%
Vitamin Comparison
Vitamin comparison score is based on the number of vitamins by which one or the other food is richer. The "coverage" charts below show how much of the daily needs can be covered by 300 grams of the food.
3
100 g
300 g
1 tbsp chopped - 10g
Vitamin C
Vit. C
Vitamin D
Vit. D
Vitamin A
Vit. A
Vitamin E
Vit. E
Vitamin B1
Vit. B1
Vitamin B2
Vit. B2
Vitamin B3
Vit. B3
Vitamin B5
Vit. B5
Vitamin B6
Vit. B6
Vitamin B12
Vit. B12
Vitamin K
Vit. K
Folate
Folate
27%
0%
0%
0.8%
15%
4.6%
3.8%
17%
80%
0%
2%
26%
6
100 g
300 g
1 cup, sliced - 104g
Vitamin C
Vit. C
Vitamin D
Vit. D
Vitamin A
Vit. A
Vitamin E
Vit. E
Vitamin B1
Vit. B1
Vitamin B2
Vit. B2
Vitamin B3
Vit. B3
Vitamin B5
Vit. B5
Vitamin B6
Vit. B6
Vitamin B12
Vit. B12
Vitamin K
Vit. K
Folate
Folate
15%
0%
1.3%
48%
24%
5.8%
11%
18%
65%
0%
2.5%
17%
All nutrients comparison - raw data values
Nutrient
DV% diff.
Vitamin E
0.04mg
2.38mg
16%
Copper
0.088mg
0.172mg
9%
Potassium
334mg
591mg
8%
Iron
1.2mg
0.55mg
8%
Vitamin B6
0.345mg
0.283mg
5%
Vitamin C
8mg
4.5mg
4%
Fiber
3.2g
4.1g
4%
Manganese
0.292mg
0.383mg
4%
Carbs
16.8g
26.46g
3%
Magnesium
21mg
33mg
3%
Phosphorus
60mg
84mg
3%
Vitamin B1
0.06mg
0.095mg
3%
Vitamin B3
0.2mg
0.6mg
3%
Folate
34µg
22µg
3%
Calories
72kcal
112kcal
2%
Protein
2.5g
1.5g
2%
Zinc
0.4mg
0.23mg
2%
Calcium
37mg
43mg
1%
Selenium
1.2µg
0.7µg
1%
Choline
11.3mg
17.3mg
1%
Protein per 100 calories
3.5g
1.3g
N/A
Calories per 10 g protein
288kcal
747kcal
N/A
Weight per 100 calories
139g
89g
N/A
Fats
0.1g
0.2g
0%
Net carbs
13.6g
22.36g
N/A
Sugar
7.87g
0.4g
N/A
Sodium
12mg
11mg
0%
Vitamin A
0µg
4µg
0%
Vitamin B2
0.02mg
0.025mg
0%
Vitamin B5
0.29mg
0.303mg
0%
Vitamin K
0.8µg
1µg
0%
Saturated fat
0.017g
0.041g
0%
Monounsaturated fat
0.014g
0.016g
0%
Polyunsaturated fat
0.039g
0.083g
0%
Tryptophan
0.028mg
0.023mg
0%
Threonine
0.098mg
0.069mg
0%
Isoleucine
0.106mg
0.054mg
0%
Leucine
0.149mg
0.111mg
0%
Lysine
0.125mg
0.067mg
0%
Methionine
0.027mg
0.02mg
0%
Phenylalanine
0.081mg
0.082mg
0%
Valine
0.11mg
0.082mg
0%
Histidine
0.043mg
0.034mg
0%
Macronutrient Comparison
Macronutrient breakdown side-by-side comparison
2
3%
17%
80%
Protein:
2.5 g
Fats:
0.1 g
Carbs:
16.8 g
Water:
79.8 g
Other:
0.8 g
3
26%
71%
Protein:
1.5 g
Fats:
0.2 g
Carbs:
26.46 g
Water:
70.64 g
Other:
1.2 g
Contains
more
Protein Protein
+66.7%
Contains
more
Water Water
+13%
Contains
more
Fats Fats
+100%
Contains
more
Carbs Carbs
+57.5%
Contains
more
Other Other
+50%
Fat Type Comparison
Fat type breakdown side-by-side comparison
1
24%
20%
56%
Saturated fat:
Sat. Fat
0.017 g
Monounsaturated fat:
Mono. Fat
0.014 g
Polyunsaturated fat:
Poly. Fat
0.039 g
2
29%
11%
59%
Saturated fat:
Sat. Fat
0.041 g
Monounsaturated fat:
Mono. Fat
0.016 g
Polyunsaturated fat:
Poly. Fat
0.083 g
Contains
less
Sat. Fat Saturated fat
-58.5%
Contains
more
Mono. Fat Monounsaturated fat
+14.3%
Contains
more
Poly. Fat Polyunsaturated fat
+112.8%