
Shallots, freeze-dried vs. Parsley — In-Depth Nutrition Comparison
Compare
What are the differences between shallots, freeze-dried and parsley?
- Shallots, freeze-dried is higher in vitamin B6, manganese, fiber, phosphorus, potassium, copper, and carbs, yet parsley is higher in vitamin K, vitamin C, and vitamin A.
- Parsley's daily need coverage for vitamin K is 1363% more.
- Shallots, freeze-dried has 19 times more vitamin B6 than parsley. While shallots, freeze-dried has 1.675mg of vitamin B6, parsley has only 0.09mg.
We used Shallots, freeze-dried and Parsley, fresh types in this article.
Infographic
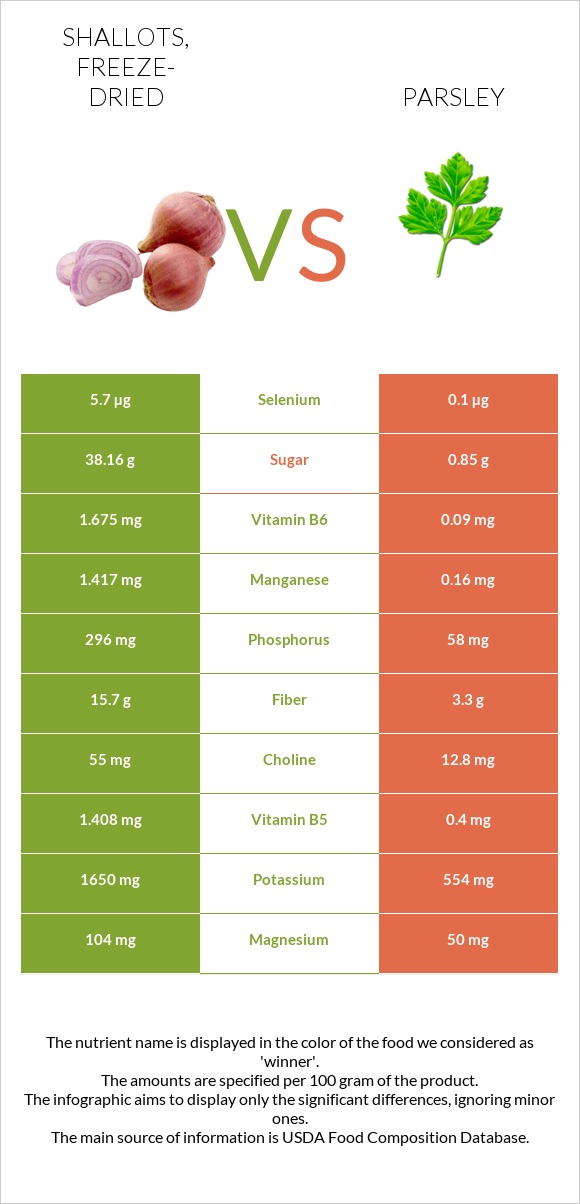
Infographic link
Mineral Comparison
The mineral comparison score is based on which food has a more favorable amount of each mineral. The �coverage� charts below show how much of the daily mineral needs are covered by the selected amount of each food.
| Contains more MagnesiumMagnesium | +108% |
| Contains more CalciumCalcium | +32.6% |
| Contains more PotassiumPotassium | +197.8% |
| Contains more CopperCopper | +185.2% |
| Contains more ZincZinc | +80.4% |
| Contains more PhosphorusPhosphorus | +410.3% |
| Contains more ManganeseManganese | +785.6% |
| Contains more SeleniumSelenium | +5600% |
Vitamin Comparison
The vitamin comparison score is based on the number of vitamins in which one food is richer than the other. The �coverage� charts below show how much of the daily vitamin needs are covered by the selected amount of each food.
| Contains more Vitamin B1Vitamin B1 | +248.8% |
| Contains more Vitamin B5Vitamin B5 | +252% |
| Contains more Vitamin B6Vitamin B6 | +1761.1% |
| Contains more Vitamin CVitamin C | +241% |
| Contains more Vitamin AVitamin A | +42000% |
| Contains more Vitamin EVitamin E | +316.7% |
| Contains more Vitamin B3Vitamin B3 | +31.3% |
| Contains more Vitamin KVitamin K | +41951.3% |
| Contains more FolateFolate | +31% |
All nutrients comparison - raw data values
| Nutrient |  |
 |
DV% diff. |
| Vitamin K | 3.9µg | 1640µg | 1363% |
| Vitamin B6 | 1.675mg | 0.09mg | 122% |
| Vitamin C | 39mg | 133mg | 104% |
| Manganese | 1.417mg | 0.16mg | 55% |
| Fiber | 15.7g | 3.3g | 50% |
| Vitamin A | 1µg | 421µg | 47% |
| Phosphorus | 296mg | 58mg | 34% |
| Potassium | 1650mg | 554mg | 32% |
| Copper | 0.425mg | 0.149mg | 31% |
| Carbs | 80.7g | 6.33g | 25% |
| Vitamin B5 | 1.408mg | 0.4mg | 20% |
| Protein | 12.3g | 2.97g | 19% |
| Vitamin B1 | 0.3mg | 0.086mg | 18% |
| Calories | 348kcal | 36kcal | 16% |
| Magnesium | 104mg | 50mg | 13% |
| Selenium | 5.7µg | 0.1µg | 10% |
| Folate | 116µg | 152µg | 9% |
| Zinc | 1.93mg | 1.07mg | 8% |
| Choline | 55mg | 12.8mg | 8% |
| Calcium | 183mg | 138mg | 5% |
| Vitamin E | 0.18mg | 0.75mg | 4% |
| Iron | 6mg | 6.2mg | 3% |
| Vitamin B3 | 1mg | 1.313mg | 2% |
| Monounsaturated fat | 0.07g | 0.295g | 1% |
| Protein per 100 calories | 3.5g | 8.3g | N/A |
| Calories per 10 g protein | 283kcal | 121kcal | N/A |
| Weight per 100 calories | 29g | 278g | N/A |
| Fats | 0.5g | 0.79g | 0% |
| Net carbs | 65g | 3.03g | N/A |
| Sugar | 38.16g | 0.85g | N/A |
| Sodium | 59mg | 56mg | 0% |
| Vitamin B2 | 0.1mg | 0.098mg | 0% |
| Saturated fat | 0.084g | 0.132g | 0% |
| Polyunsaturated fat | 0.196g | 0.124g | 0% |
| Tryptophan | 0.138mg | 0.045mg | 0% |
| Threonine | 0.482mg | 0.122mg | 0% |
| Isoleucine | 0.522mg | 0.118mg | 0% |
| Leucine | 0.734mg | 0.204mg | 0% |
| Lysine | 0.614mg | 0.181mg | 0% |
| Methionine | 0.134mg | 0.042mg | 0% |
| Phenylalanine | 0.396mg | 0.145mg | 0% |
| Valine | 0.543mg | 0.172mg | 0% |
| Histidine | 0.213mg | 0.061mg | 0% |
Macronutrient Comparison
Macronutrient breakdown side-by-side comparison
Protein:
12.3 g
Fats:
0.5 g
Carbs:
80.7 g
Water:
2 g
Other:
4.5 g
Protein:
2.97 g
Fats:
0.79 g
Carbs:
6.33 g
Water:
87.71 g
Other:
2.2 g
| Contains more ProteinProtein | +314.1% |
| Contains more CarbsCarbs | +1174.9% |
| Contains more FatsFats | +58% |
| Contains more WaterWater | +4285.5% |
Fat Type Comparison
Fat type breakdown side-by-side comparison
Saturated fat:
Sat. Fat
0.084 g
Monounsaturated fat:
Mono. Fat
0.07 g
Polyunsaturated fat:
Poly. Fat
0.196 g
Saturated fat:
Sat. Fat
0.132 g
Monounsaturated fat:
Mono. Fat
0.295 g
Polyunsaturated fat:
Poly. Fat
0.124 g
| Contains less Sat. FatSaturated fat | -36.4% |
| Contains more Poly. FatPolyunsaturated fat | +58.1% |
| Contains more Mono. FatMonounsaturated fat | +321.4% |