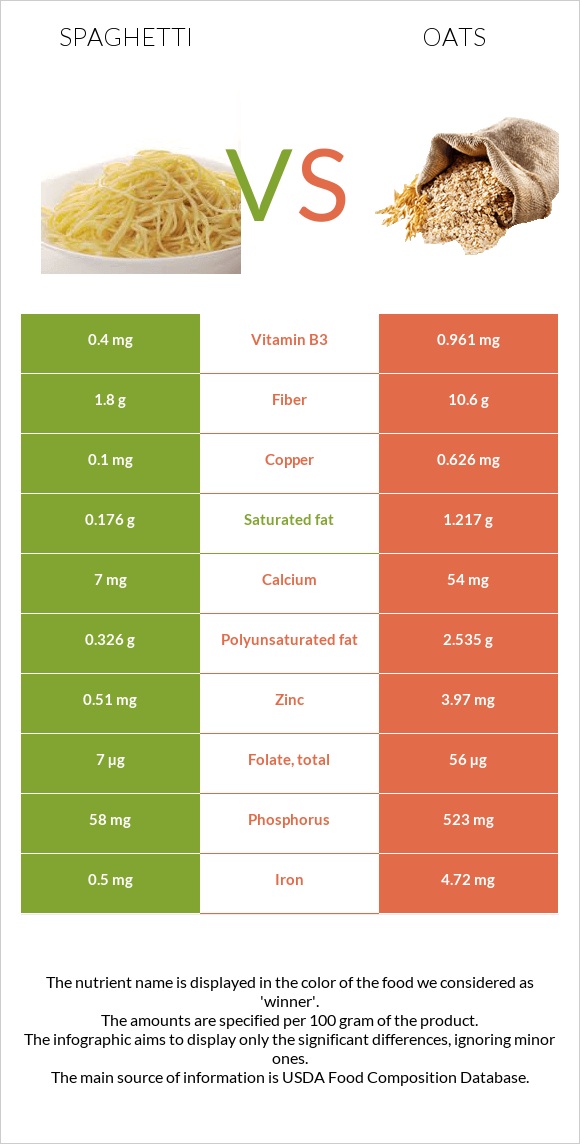
How are spaghetti and oats different? Oats have more manganese, phosphorus, vitamin B1, copper, iron, magnesium, fiber, zinc, vitamin B5, and folate than spaghetti. Daily need coverage for manganese for oats is 200% higher. Pasta, cooked, unenriched, without added salt and Oats are the varieties used in this article.
Infographic
Mineral Comparison
Mineral comparison score is based on the number of minerals by which one or the other food is richer. The "coverage" charts below show how much of the daily needs can be covered by 300 grams of the food.
2
100 g
300 g
1 cup shells - 105g 1 cup penne - 107g 1 cup rotini - 107g 1 cup farfalle - 107g 1 cup lasagne - 116g 1 cup elbows not packed - 120g 1 cup spaghetti not packed - 124g 1 cup elbows packed - 132g 1 cup spaghetti packed - 151g
Magnesium
Magnesium
Calcium
Calcium
Potassium
Potassium
Iron
Iron
Copper
Copper
Zinc
Zinc
Phosphorus
Phosphorus
Sodium
Sodium
Manganese
Manganese
Selenium
Selenium
13%
2.1%
3.9%
19%
33%
14%
25%
0.13%
42%
144%
8
100 g
300 g
1 cup - 156g
Magnesium
Magnesium
Calcium
Calcium
Potassium
Potassium
Iron
Iron
Copper
Copper
Zinc
Zinc
Phosphorus
Phosphorus
Sodium
Sodium
Manganese
Manganese
Selenium
Selenium
126%
16%
38%
177%
209%
108%
224%
0.26%
641%
0%
Vitamin Comparison
Vitamin comparison score is based on the number of vitamins by which one or the other food is richer. The "coverage" charts below show how much of the daily needs can be covered by 300 grams of the food.
1
100 g
300 g
1 cup shells - 105g 1 cup penne - 107g 1 cup rotini - 107g 1 cup farfalle - 107g 1 cup lasagne - 116g 1 cup elbows not packed - 120g 1 cup spaghetti not packed - 124g 1 cup elbows packed - 132g 1 cup spaghetti packed - 151g
Vitamin C
Vit. C
Vitamin D
Vit. D
Vitamin A
Vit. A
Vitamin E
Vit. E
Vitamin B1
Vit. B1
Vitamin B2
Vit. B2
Vitamin B3
Vit. B3
Vitamin B5
Vit. B5
Vitamin B6
Vit. B6
Vitamin B12
Vit. B12
Vitamin K
Vit. K
Folate
Folate
0%
0%
0%
1.2%
5%
4.6%
7.5%
6.7%
11%
0%
0%
5.3%
6
100 g
300 g
1 cup - 156g
Vitamin C
Vit. C
Vitamin D
Vit. D
Vitamin A
Vit. A
Vitamin E
Vit. E
Vitamin B1
Vit. B1
Vitamin B2
Vit. B2
Vitamin B3
Vit. B3
Vitamin B5
Vit. B5
Vitamin B6
Vit. B6
Vitamin B12
Vit. B12
Vitamin K
Vit. K
Folate
Folate
0%
0%
0%
0%
191%
32%
18%
81%
27%
0%
0%
42%
All nutrients comparison - raw data values
Nutrient
DV% diff.
Manganese
0.322mg
4.916mg
200%
Phosphorus
58mg
523mg
66%
Vitamin B1
0.02mg
0.763mg
62%
Copper
0.1mg
0.626mg
58%
Iron
0.5mg
4.72mg
53%
Selenium
26.4µg
48%
Magnesium
18mg
177mg
38%
Fiber
1.8g
10.6g
35%
Zinc
0.51mg
3.97mg
31%
Vitamin B5
0.112mg
1.349mg
25%
Protein
5.8g
16.89g
22%
Polyunsaturated fat
0.326g
2.535g
15%
Calories
158kcal
389kcal
12%
Carbs
30.86g
66.27g
12%
Folate
7µg
56µg
12%
Potassium
44mg
429mg
11%
Starch
26.01g
11%
Fats
0.93g
6.9g
9%
Vitamin B2
0.02mg
0.139mg
9%
Calcium
7mg
54mg
5%
Vitamin B6
0.049mg
0.119mg
5%
Saturated fat
0.176g
1.217g
5%
Monounsaturated fat
0.131g
2.178g
5%
Vitamin B3
0.4mg
0.961mg
4%
Choline
6.4mg
1%
Protein per 100 calories
3.7g
4.3g
N/A
Calories per 10 g protein
272kcal
230kcal
N/A
Weight per 100 calories
63g
26g
N/A
Unsaturated / Saturated Fat ratio
2.6
3.9
N/A
Net carbs
29.06g
55.67g
N/A
Sugar
0.56g
N/A
Sodium
1mg
2mg
0%
Vitamin E
0.06mg
0%
Tryptophan
0.083mg
0.234mg
0%
Threonine
0.206mg
0.575mg
0%
Isoleucine
0.228mg
0.694mg
0%
Leucine
0.44mg
1.284mg
0%
Lysine
0.133mg
0.701mg
0%
Methionine
0.065mg
0.312mg
0%
Phenylalanine
0.297mg
0.895mg
0%
Valine
0.262mg
0.937mg
0%
Histidine
0.132mg
0.405mg
0%
Fructose
0.03g
0%
Omega-3 - ALA
0.024g
N/A
Macronutrient Comparison
Macronutrient breakdown side-by-side comparison
1
6%
31%
62%
Protein:
5.8 g
Fats:
0.93 g
Carbs:
30.86 g
Water:
62.13 g
Other:
0.28 g
4
17%
7%
66%
8%
2%
Protein:
16.89 g
Fats:
6.9 g
Carbs:
66.27 g
Water:
8.22 g
Other:
1.72 g
Contains
more
Water Water
+655.8%
Contains
more
Protein Protein
+191.2%
Contains
more
Fats Fats
+641.9%
Contains
more
Carbs Carbs
+114.7%
Contains
more
Other Other
+514.3%
Fat Type Comparison
Fat type breakdown side-by-side comparison
1
28%
21%
52%
Saturated fat:
Sat. Fat
0.176 g
Monounsaturated fat:
Mono. Fat
0.131 g
Polyunsaturated fat:
Poly. Fat
0.326 g
2
21%
37%
43%
Saturated fat:
Sat. Fat
1.217 g
Monounsaturated fat:
Mono. Fat
2.178 g
Polyunsaturated fat:
Poly. Fat
2.535 g
Contains
less
Sat. Fat Saturated fat
-85.5%
Contains
more
Mono. Fat Monounsaturated fat
+1562.6%
Contains
more
Poly. Fat Polyunsaturated fat
+677.6%