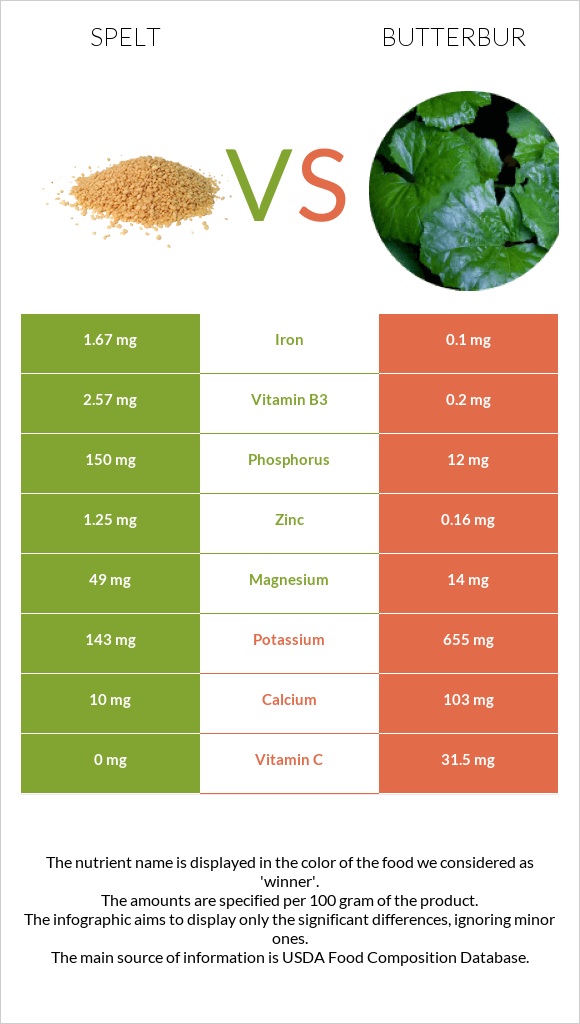
What are the differences between spelt and butterbur? Spelt is higher in manganese, phosphorus, iron, vitamin B3, copper, zinc, and magnesium, yet butterbur is higher in vitamin C, potassium, and calcium. Spelt's daily need coverage for manganese is 36% more. Spelt has 17 times more iron than butterbur. While spelt has 1.67mg of iron, butterbur has only 0.1mg. We used Spelt, cooked and Butterbur, (fuki), raw types in this article.
Infographic
Mineral Comparison
Mineral comparison score is based on the number of minerals by which one or the other food is richer. The "coverage" charts below show how much of the daily needs can be covered by 300 grams of the food.
8
100 g
300 g
1 cup - 194g
Magnesium
Magnesium
Calcium
Calcium
Potassium
Potassium
Iron
Iron
Copper
Copper
Zinc
Zinc
Phosphorus
Phosphorus
Sodium
Sodium
Manganese
Manganese
Selenium
Selenium
35%
3%
13%
63%
72%
34%
64%
0.65%
142%
22%
2
100 g
300 g
1 petiole - 5g 1 cup - 94g
Magnesium
Magnesium
Calcium
Calcium
Potassium
Potassium
Iron
Iron
Copper
Copper
Zinc
Zinc
Phosphorus
Phosphorus
Sodium
Sodium
Manganese
Manganese
Selenium
Selenium
10%
31%
58%
3.8%
34%
4.4%
5.1%
0.91%
36%
4.9%
Vitamin Comparison
Vitamin comparison score is based on the number of vitamins by which one or the other food is richer. The "coverage" charts below show how much of the daily needs can be covered by 300 grams of the food.
5
100 g
300 g
1 cup - 194g
Vitamin C
Vit. C
Vitamin D
Vit. D
Vitamin A
Vit. A
Vitamin E
Vit. E
Vitamin B1
Vit. B1
Vitamin B2
Vit. B2
Vitamin B3
Vit. B3
Vitamin B5
Vit. B5
Vitamin B6
Vit. B6
Vitamin B12
Vit. B12
Vitamin K
Vit. K
Folate
Folate
0%
0%
0%
5.2%
26%
6.9%
48%
0%
18%
0%
0%
9.8%
4
100 g
300 g
1 petiole - 5g 1 cup - 94g
Vitamin C
Vit. C
Vitamin D
Vit. D
Vitamin A
Vit. A
Vitamin E
Vit. E
Vitamin B1
Vit. B1
Vitamin B2
Vit. B2
Vitamin B3
Vit. B3
Vitamin B5
Vit. B5
Vitamin B6
Vit. B6
Vitamin B12
Vit. B12
Vitamin K
Vit. K
Folate
Folate
105%
0%
1%
0%
5%
4.6%
3.8%
1.9%
22%
0%
0%
7.5%
All nutrients comparison - raw data values
Macronutrient Comparison
Macronutrient breakdown side-by-side comparison
3
6%
26%
67%
Protein:
5.5 g
Fats:
0.85 g
Carbs:
26.44 g
Water:
66.56 g
Other:
0.65 g
2
4%
95%
Protein:
0.39 g
Fats:
0.04 g
Carbs:
3.61 g
Water:
94.5 g
Other:
1.46 g
Contains
more
Protein Protein
+1310.3%
Contains
more
Fats Fats
+2025%
Contains
more
Carbs Carbs
+632.4%
Contains
more
Water Water
+42%
Contains
more
Other Other
+124.6%