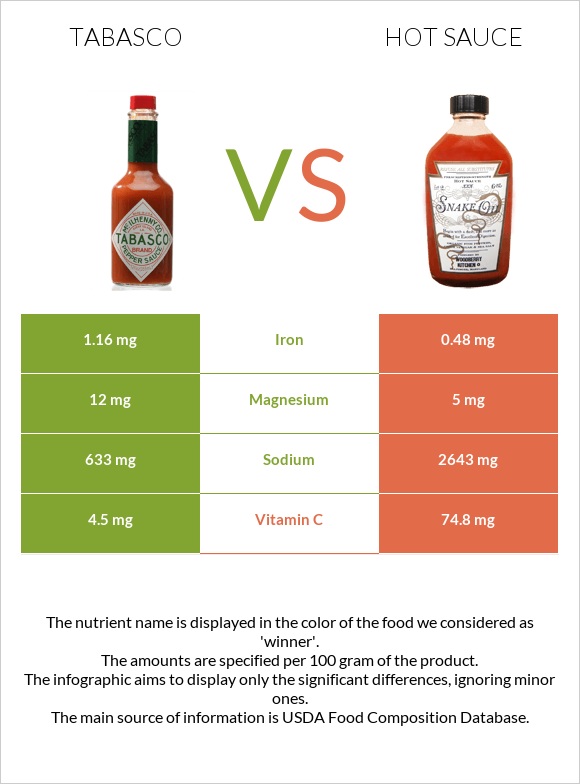
What are the differences between tabasco and hot sauce? Tabasco is higher in vitamin A, iron, and copper; however, hot sauce is richer in vitamin C. Hot sauce's daily need coverage for sodium is 87% more. Hot sauce contains 10 times less vitamin A than tabasco. Tabasco contains 1640 IU of vitamin A, while hot sauce contains 162 IU. Tabasco has less sodium. We used Sauce, ready-to-serve, pepper, TABASCO and Sauce, ready-to-serve, pepper or hot types in this article.
Infographic
Mineral Comparison
Mineral comparison score is based on the number of minerals by which one or the other food is richer. The "coverage" charts below show how much of the daily needs can be covered by 300 grams of the food.
9
100 g
300 g
0.25 tsp - 1.2g 1 tsp - 4.7g
Magnesium
Magnesium
Calcium
Calcium
Potassium
Potassium
Iron
Iron
Copper
Copper
Zinc
Zinc
Phosphorus
Phosphorus
Sodium
Sodium
Manganese
Manganese
Selenium
Selenium
8.6%
3.6%
11%
44%
25%
4.4%
9.9%
83%
14%
2.7%
1
100 g
300 g
0.25 tsp - 1.2g 1 tsp - 4.7g
Magnesium
Magnesium
Calcium
Calcium
Potassium
Potassium
Iron
Iron
Copper
Copper
Zinc
Zinc
Phosphorus
Phosphorus
Sodium
Sodium
Manganese
Manganese
Selenium
Selenium
3.6%
2.4%
13%
18%
9.3%
3%
4.7%
345%
6.4%
0%
Vitamin Comparison
Vitamin comparison score is based on the number of vitamins by which one or the other food is richer. The "coverage" charts below show how much of the daily needs can be covered by 300 grams of the food.
1
100 g
300 g
0.25 tsp - 1.2g 1 tsp - 4.7g
Vitamin C
Vit. C
Vitamin D
Vit. D
Vitamin A
Vit. A
Vitamin E
Vit. E
Vitamin B1
Vit. B1
Vitamin B2
Vit. B2
Vitamin B3
Vit. B3
Vitamin B5
Vit. B5
Vitamin B6
Vit. B6
Vitamin B12
Vit. B12
Vitamin K
Vit. K
Folate
Folate
15%
0%
27%
0.2%
8%
19%
3.3%
6.6%
36%
0%
0.5%
0.75%
6
100 g
300 g
0.25 tsp - 1.2g 1 tsp - 4.7g
Vitamin C
Vit. C
Vitamin D
Vit. D
Vitamin A
Vit. A
Vitamin E
Vit. E
Vitamin B1
Vit. B1
Vitamin B2
Vit. B2
Vitamin B3
Vit. B3
Vitamin B5
Vit. B5
Vitamin B6
Vit. B6
Vitamin B12
Vit. B12
Vitamin K
Vit. K
Folate
Folate
249%
0%
2.7%
2.4%
9%
19%
4.8%
6.6%
36%
0%
6%
4.5%
All nutrients comparison - raw data values
Nutrient
DV% diff.
Sodium
633mg
2643mg
87%
Vitamin C
4.5mg
74.8mg
78%
Iron
1.16mg
0.48mg
9%
Vitamin A
82µg
8µg
8%
Copper
0.075mg
0.028mg
5%
Manganese
0.107mg
0.049mg
3%
Protein
1.29g
0.51g
2%
Magnesium
12mg
5mg
2%
Phosphorus
23mg
11mg
2%
Vitamin K
0.2µg
2.4µg
2%
Fats
0.76g
0.37g
1%
Fiber
0.6g
0.3g
1%
Vitamin E
0.01mg
0.12mg
1%
Selenium
0.5µg
0µg
1%
Folate
1µg
6µg
1%
Polyunsaturated fat
0.401g
0.196g
1%
Calories
12kcal
11kcal
0%
Protein per 100 calories
11g
4.6g
N/A
Calories per 10 g protein
93kcal
216kcal
N/A
Weight per 100 calories
833g
909g
N/A
Net carbs
0.2g
1.45g
N/A
Carbs
0.8g
1.75g
0%
Calcium
12mg
8mg
0%
Potassium
128mg
144mg
0%
Sugar
0.13g
1.26g
N/A
Zinc
0.16mg
0.11mg
0%
Vitamin B1
0.032mg
0.036mg
0%
Vitamin B2
0.084mg
0.082mg
0%
Vitamin B3
0.178mg
0.254mg
0%
Vitamin B5
0.11mg
0.11mg
0%
Vitamin B6
0.154mg
0.157mg
0%
Saturated fat
0.106g
0.052g
0%
Monounsaturated fat
0.061g
0.03g
0%
Tryptophan
0.017mg
0.007mg
0%
Threonine
0.048mg
0.019mg
0%
Isoleucine
0.042mg
0.017mg
0%
Leucine
0.068mg
0.027mg
0%
Lysine
0.057mg
0.023mg
0%
Methionine
0.016mg
0.006mg
0%
Phenylalanine
0.04mg
0.016mg
0%
Valine
0.055mg
0.022mg
0%
Histidine
0.026mg
0.01mg
0%
Macronutrient Comparison
Macronutrient breakdown side-by-side comparison
3
95%
2%
Protein:
1.29 g
Fats:
0.76 g
Carbs:
0.8 g
Water:
95.17 g
Other:
1.98 g
2
2%
90%
7%
Protein:
0.51 g
Fats:
0.37 g
Carbs:
1.75 g
Water:
89.98 g
Other:
7.39 g
Contains
more
Protein Protein
+152.9%
Contains
more
Fats Fats
+105.4%
Contains
more
Carbs Carbs
+118.8%
Contains
more
Other Other
+273.2%
Fat Type Comparison
Fat type breakdown side-by-side comparison
2
19%
11%
71%
Saturated fat:
Sat. Fat
0.106 g
Monounsaturated fat:
Mono. Fat
0.061 g
Polyunsaturated fat:
Poly. Fat
0.401 g
1
19%
11%
71%
Saturated fat:
Sat. Fat
0.052 g
Monounsaturated fat:
Mono. Fat
0.03 g
Polyunsaturated fat:
Poly. Fat
0.196 g
Contains
more
Mono. Fat Monounsaturated fat
+103.3%
Contains
more
Poly. Fat Polyunsaturated fat
+104.6%
Contains
less
Sat. Fat Saturated fat
-50.9%