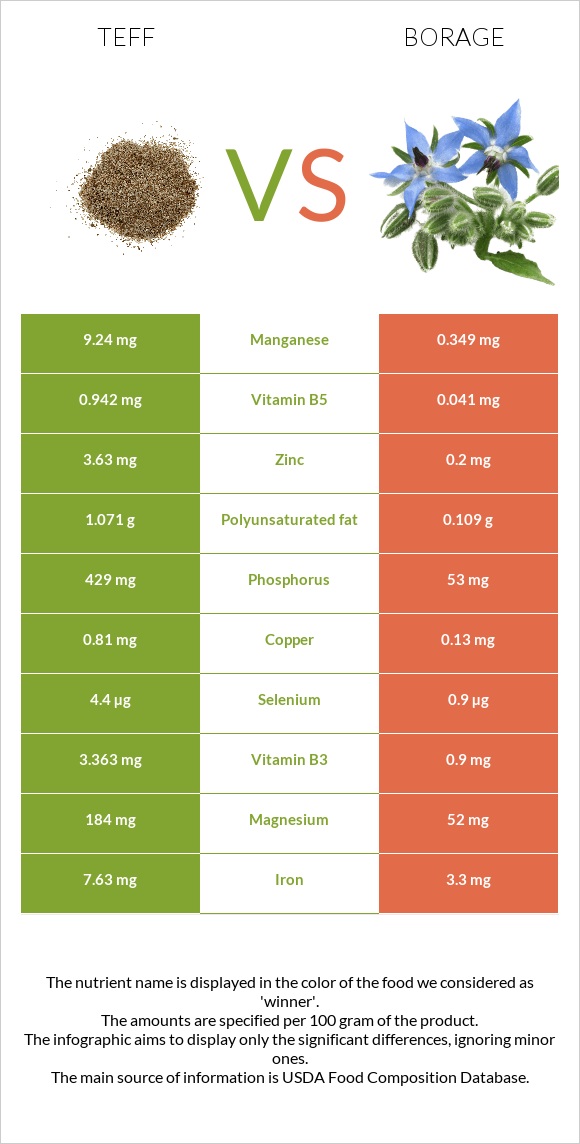
A recap on the differences between teff and borage Teff has more manganese, copper, iron, phosphorus, magnesium, zinc, vitamin B6, vitamin B1, and vitamin B5; however, borage is higher in vitamin A. Teff covers your daily manganese needs 387% more than borage. Borage contains 23 times less vitamin B5 than teff. Teff contains 0.942mg of vitamin B5, while borage contains 0.041mg. Food varieties used in this article are Teff, uncooked and Borage, raw .
Infographic
Mineral Comparison
Mineral comparison score is based on the number of minerals by which one or the other food is richer. The "coverage" charts below show how much of the daily needs can be covered by 300 grams of the food.
9
100 g
300 g
1 cup - 193g
Magnesium
Magnesium
Calcium
Calcium
Potassium
Potassium
Iron
Iron
Copper
Copper
Zinc
Zinc
Phosphorus
Phosphorus
Sodium
Sodium
Manganese
Manganese
Selenium
Selenium
131%
54%
38%
286%
270%
99%
184%
1.6%
1205%
24%
1
100 g
300 g
1 cup (1" pieces) - 89g
Magnesium
Magnesium
Calcium
Calcium
Potassium
Potassium
Iron
Iron
Copper
Copper
Zinc
Zinc
Phosphorus
Phosphorus
Sodium
Sodium
Manganese
Manganese
Selenium
Selenium
37%
28%
41%
124%
43%
5.5%
23%
10%
46%
4.9%
Vitamin Comparison
Vitamin comparison score is based on the number of vitamins by which one or the other food is richer. The "coverage" charts below show how much of the daily needs can be covered by 300 grams of the food.
7
100 g
300 g
1 cup - 193g
Vitamin C
Vit. C
Vitamin D
Vit. D
Vitamin A
Vit. A
Vitamin E
Vit. E
Vitamin B1
Vit. B1
Vitamin B2
Vit. B2
Vitamin B3
Vit. B3
Vitamin B5
Vit. B5
Vitamin B6
Vit. B6
Vitamin B12
Vit. B12
Vitamin K
Vit. K
Folate
Folate
0%
0%
0%
1.6%
98%
62%
63%
57%
111%
0%
4.8%
0%
3
100 g
300 g
1 cup (1" pieces) - 89g
Vitamin C
Vit. C
Vitamin D
Vit. D
Vitamin A
Vit. A
Vitamin E
Vit. E
Vitamin B1
Vit. B1
Vitamin B2
Vit. B2
Vitamin B3
Vit. B3
Vitamin B5
Vit. B5
Vitamin B6
Vit. B6
Vitamin B12
Vit. B12
Vitamin K
Vit. K
Folate
Folate
117%
0%
70%
0%
15%
35%
17%
2.5%
19%
0%
0%
9.8%
All nutrients comparison - raw data values
Nutrient
DV% diff.
Manganese
9.24mg
0.349mg
387%
Copper
0.81mg
0.13mg
76%
Iron
7.63mg
3.3mg
54%
Phosphorus
429mg
53mg
54%
Vitamin C
35mg
39%
Fiber
8g
32%
Magnesium
184mg
52mg
31%
Zinc
3.63mg
0.2mg
31%
Vitamin B6
0.482mg
0.084mg
31%
Vitamin B1
0.39mg
0.06mg
28%
Protein
13.3g
1.8g
23%
Carbs
73.13g
3.06g
23%
Vitamin A
0µg
210µg
23%
Vitamin B5
0.942mg
0.041mg
18%
Calories
367kcal
21kcal
17%
Starch
36.56g
15%
Vitamin B3
3.363mg
0.9mg
15%
Calcium
180mg
93mg
9%
Vitamin B2
0.27mg
0.15mg
9%
Selenium
4.4µg
0.9µg
6%
Polyunsaturated fat
1.071g
0.109g
6%
Fats
2.38g
0.7g
3%
Sodium
12mg
80mg
3%
Folate
13µg
3%
Vitamin K
1.9µg
2%
Choline
13.1mg
2%
Potassium
427mg
470mg
1%
Vitamin E
0.08mg
1%
Saturated fat
0.449g
0.17g
1%
Monounsaturated fat
0.589g
0.211g
1%
Fructose
0.47g
1%
Protein per 100 calories
3.6g
8.6g
N/A
Calories per 10 g protein
276kcal
117kcal
N/A
Weight per 100 calories
27g
476g
N/A
Unsaturated / Saturated Fat ratio
3.7
1.9
N/A
Net carbs
65.13g
3.06g
N/A
Sugar
1.84g
N/A
Tryptophan
0.139mg
0%
Threonine
0.51mg
0%
Isoleucine
0.501mg
0%
Leucine
1.068mg
0%
Lysine
0.376mg
0%
Methionine
0.428mg
0%
Phenylalanine
0.698mg
0%
Valine
0.686mg
0%
Histidine
0.301mg
0%
Omega-3 - ALA
0.135g
N/A
Macronutrient Comparison
Macronutrient breakdown side-by-side comparison
4
13%
2%
73%
9%
2%
Protein:
13.3 g
Fats:
2.38 g
Carbs:
73.13 g
Water:
8.82 g
Other:
2.37 g
1
2%
3%
93%
Protein:
1.8 g
Fats:
0.7 g
Carbs:
3.06 g
Water:
93 g
Other:
1.44 g
Contains
more
Protein Protein
+638.9%
Contains
more
Fats Fats
+240%
Contains
more
Carbs Carbs
+2289.9%
Contains
more
Other Other
+64.6%
Contains
more
Water Water
+954.4%
Fat Type Comparison
Fat type breakdown side-by-side comparison
2
21%
28%
51%
Saturated fat:
Sat. Fat
0.449 g
Monounsaturated fat:
Mono. Fat
0.589 g
Polyunsaturated fat:
Poly. Fat
1.071 g
1
35%
43%
22%
Saturated fat:
Sat. Fat
0.17 g
Monounsaturated fat:
Mono. Fat
0.211 g
Polyunsaturated fat:
Poly. Fat
0.109 g
Contains
more
Mono. Fat Monounsaturated fat
+179.1%
Contains
more
Poly. Fat Polyunsaturated fat
+882.6%
Contains
less
Sat. Fat Saturated fat
-62.1%