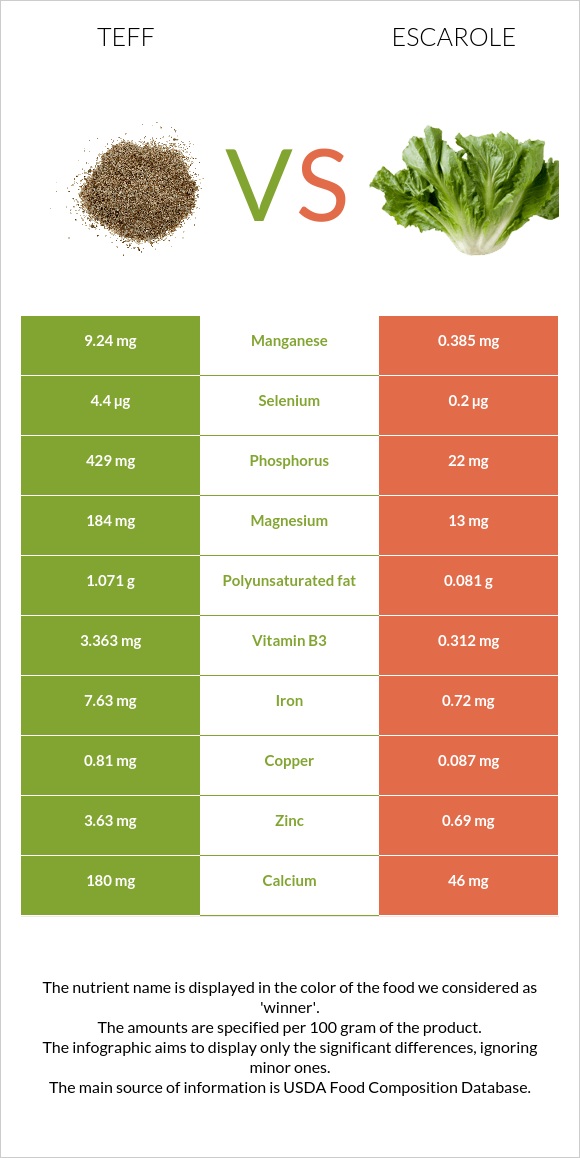
What are the main differences between teff and escarole? Teff is richer in manganese, iron, copper, phosphorus, magnesium, vitamin B6, vitamin B1, and zinc, yet escarole is richer in vitamin K and vitamin A. Teff's daily need coverage for manganese is 385% higher. Teff has 30 times more vitamin B6 than escarole. Teff has 0.482mg of vitamin B6, while escarole has 0.016mg. We used Teff, uncooked and Escarole, cooked, boiled, drained, no salt added types in this comparison.
Infographic
Mineral Comparison
Mineral comparison score is based on the number of minerals by which one or the other food is richer. The "coverage" charts below show how much of the daily needs can be covered by 300 grams of the food.
10
100 g
300 g
1 cup - 193g
Magnesium
Magnesium
Calcium
Calcium
Potassium
Potassium
Iron
Iron
Copper
Copper
Zinc
Zinc
Phosphorus
Phosphorus
Sodium
Sodium
Manganese
Manganese
Selenium
Selenium
131%
54%
38%
286%
270%
99%
184%
1.6%
1205%
24%
0
100 g
300 g
1 cup - 150g
Magnesium
Magnesium
Calcium
Calcium
Potassium
Potassium
Iron
Iron
Copper
Copper
Zinc
Zinc
Phosphorus
Phosphorus
Sodium
Sodium
Manganese
Manganese
Selenium
Selenium
9.3%
14%
22%
27%
29%
19%
9.4%
2.5%
50%
1.1%
Vitamin Comparison
Vitamin comparison score is based on the number of vitamins by which one or the other food is richer. The "coverage" charts below show how much of the daily needs can be covered by 300 grams of the food.
5
100 g
300 g
1 cup - 193g
Vitamin C
Vit. C
Vitamin D
Vit. D
Vitamin A
Vit. A
Vitamin E
Vit. E
Vitamin B1
Vit. B1
Vitamin B2
Vit. B2
Vitamin B3
Vit. B3
Vitamin B5
Vit. B5
Vitamin B6
Vit. B6
Vitamin B12
Vit. B12
Vitamin K
Vit. K
Folate
Folate
0%
0%
0%
1.6%
98%
62%
63%
57%
111%
0%
4.8%
0%
5
100 g
300 g
1 cup - 150g
Vitamin C
Vit. C
Vitamin D
Vit. D
Vitamin A
Vit. A
Vitamin E
Vit. E
Vitamin B1
Vit. B1
Vitamin B2
Vit. B2
Vitamin B3
Vit. B3
Vitamin B5
Vit. B5
Vitamin B6
Vit. B6
Vitamin B12
Vit. B12
Vitamin K
Vit. K
Folate
Folate
11%
0%
31%
8%
15%
14%
5.9%
50%
3.7%
0%
530%
59%
All nutrients comparison - raw data values
Nutrient
DV% diff.
Manganese
9.24mg
0.385mg
385%
Vitamin K
1.9µg
211.9µg
175%
Iron
7.63mg
0.72mg
86%
Copper
0.81mg
0.087mg
80%
Phosphorus
429mg
22mg
58%
Magnesium
184mg
13mg
41%
Vitamin B6
0.482mg
0.016mg
36%
Vitamin B1
0.39mg
0.059mg
28%
Zinc
3.63mg
0.69mg
27%
Protein
13.3g
1.15g
24%
Carbs
73.13g
3.07g
23%
Fiber
8g
2.8g
21%
Folate
78µg
20%
Vitamin B3
3.363mg
0.312mg
19%
Calories
367kcal
19kcal
17%
Vitamin B2
0.27mg
0.062mg
16%
Starch
36.56g
15%
Calcium
180mg
46mg
13%
Vitamin A
0µg
94µg
10%
Selenium
4.4µg
0.2µg
8%
Polyunsaturated fat
1.071g
0.081g
7%
Potassium
427mg
245mg
5%
Vitamin C
3.3mg
4%
Fats
2.38g
0.18g
3%
Vitamin E
0.08mg
0.4mg
2%
Vitamin B5
0.942mg
0.826mg
2%
Saturated fat
0.449g
0.042g
2%
Monounsaturated fat
0.589g
0.004g
1%
Fructose
0.47g
1%
Protein per 100 calories
3.6g
6.1g
N/A
Calories per 10 g protein
276kcal
165kcal
N/A
Weight per 100 calories
27g
526g
N/A
Unsaturated / Saturated Fat ratio
3.7
2
N/A
Net carbs
65.13g
0.27g
N/A
Sugar
1.84g
0.23g
N/A
Sodium
12mg
19mg
0%
Choline
13.1mg
15.4mg
0%
Tryptophan
0.139mg
0.005mg
0%
Threonine
0.51mg
0.046mg
0%
Isoleucine
0.501mg
0.066mg
0%
Leucine
1.068mg
0.09mg
0%
Lysine
0.376mg
0.058mg
0%
Methionine
0.428mg
0.013mg
0%
Phenylalanine
0.698mg
0.049mg
0%
Valine
0.686mg
0.058mg
0%
Histidine
0.301mg
0.021mg
0%
Omega-3 - ALA
0.135g
N/A
Macronutrient Comparison
Macronutrient breakdown side-by-side comparison
4
13%
2%
73%
9%
2%
Protein:
13.3 g
Fats:
2.38 g
Carbs:
73.13 g
Water:
8.82 g
Other:
2.37 g
1
3%
94%
Protein:
1.15 g
Fats:
0.18 g
Carbs:
3.07 g
Water:
94.29 g
Other:
1.31 g
Contains
more
Protein Protein
+1056.5%
Contains
more
Fats Fats
+1222.2%
Contains
more
Carbs Carbs
+2282.1%
Contains
more
Other Other
+80.9%
Contains
more
Water Water
+969%
Fat Type Comparison
Fat type breakdown side-by-side comparison
2
21%
28%
51%
Saturated fat:
Sat. Fat
0.449 g
Monounsaturated fat:
Mono. Fat
0.589 g
Polyunsaturated fat:
Poly. Fat
1.071 g
1
33%
3%
64%
Saturated fat:
Sat. Fat
0.042 g
Monounsaturated fat:
Mono. Fat
0.004 g
Polyunsaturated fat:
Poly. Fat
0.081 g
Contains
more
Mono. Fat Monounsaturated fat
+14625%
Contains
more
Poly. Fat Polyunsaturated fat
+1222.2%
Contains
less
Sat. Fat Saturated fat
-90.6%