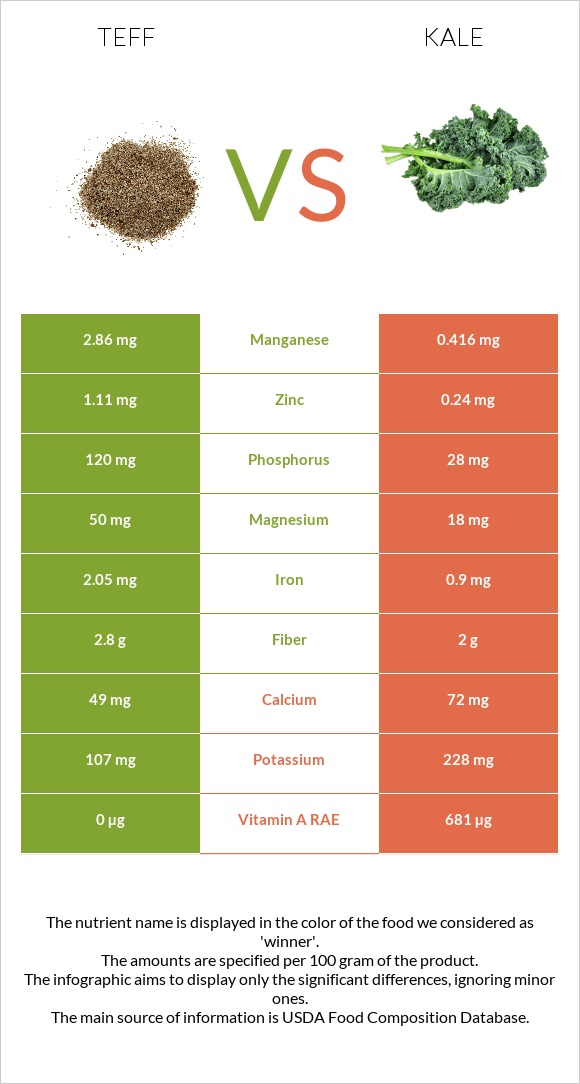
What are the differences between teff and kale? Teff is higher in manganese, iron, phosphorus, vitamin B1, zinc, copper, and magnesium, yet kale is higher in vitamin A. Kale's daily need coverage for vitamin A is 272% more. Teff has 7 times more manganese than kale. While teff has 2.86mg of manganese, kale has only 0.416mg. We used Teff, cooked and Kale, cooked, boiled, drained, without salt types in this article.
Infographic
Mineral Comparison
Mineral comparison score is based on the number of minerals by which one or the other food is richer. The "coverage" charts below show how much of the daily needs can be covered by 300 grams of the food.
7
100 g
300 g
1 cup - 252g
Magnesium
Magnesium
Calcium
Calcium
Potassium
Potassium
Iron
Iron
Copper
Copper
Zinc
Zinc
Phosphorus
Phosphorus
Sodium
Sodium
Manganese
Manganese
Selenium
Selenium
36%
15%
9.4%
77%
75%
30%
51%
1%
373%
0%
3
100 g
300 g
1 cup, chopped - 130g
Magnesium
Magnesium
Calcium
Calcium
Potassium
Potassium
Iron
Iron
Copper
Copper
Zinc
Zinc
Phosphorus
Phosphorus
Sodium
Sodium
Manganese
Manganese
Selenium
Selenium
13%
22%
20%
34%
52%
6.5%
12%
3%
54%
4.9%
Vitamin Comparison
Vitamin comparison score is based on the number of vitamins by which one or the other food is richer. The "coverage" charts below show how much of the daily needs can be covered by 300 grams of the food.
3
100 g
300 g
1 cup - 252g
Vitamin C
Vit. C
Vitamin D
Vit. D
Vitamin A
Vit. A
Vitamin E
Vit. E
Vitamin B1
Vit. B1
Vitamin B2
Vit. B2
Vitamin B3
Vit. B3
Vitamin B5
Vit. B5
Vitamin B6
Vit. B6
Vitamin B12
Vit. B12
Vitamin K
Vit. K
Folate
Folate
0%
0%
0%
0%
46%
7.6%
17%
0%
22%
0%
0%
14%
7
100 g
300 g
1 cup, chopped - 130g
Vitamin C
Vit. C
Vitamin D
Vit. D
Vitamin A
Vit. A
Vitamin E
Vit. E
Vitamin B1
Vit. B1
Vitamin B2
Vit. B2
Vitamin B3
Vit. B3
Vitamin B5
Vit. B5
Vitamin B6
Vit. B6
Vitamin B12
Vit. B12
Vitamin K
Vit. K
Folate
Folate
137%
0%
227%
17%
13%
16%
9.4%
2.9%
32%
0%
2043%
9.8%
All nutrients comparison - raw data values
Nutrient
DV% diff.
Vitamin K
817µg
681%
Manganese
2.86mg
0.416mg
106%
Vitamin A
0µg
681µg
76%
Vitamin C
41mg
46%
Iron
2.05mg
0.9mg
14%
Phosphorus
120mg
28mg
13%
Vitamin B1
0.183mg
0.053mg
11%
Magnesium
50mg
18mg
8%
Copper
0.226mg
0.156mg
8%
Zinc
1.11mg
0.24mg
8%
Vitamin E
0.85mg
6%
Carbs
19.86g
5.63g
5%
Calories
101kcal
28kcal
4%
Protein
3.87g
1.9g
4%
Potassium
107mg
228mg
4%
Fiber
2.8g
2g
3%
Vitamin B2
0.033mg
0.07mg
3%
Vitamin B3
0.909mg
0.5mg
3%
Vitamin B6
0.097mg
0.138mg
3%
Calcium
49mg
72mg
2%
Selenium
0.9µg
2%
Sodium
8mg
23mg
1%
Vitamin B5
0.049mg
1%
Folate
18µg
13µg
1%
Polyunsaturated fat
0.193g
1%
Protein per 100 calories
3.8g
6.8g
N/A
Calories per 10 g protein
261kcal
147kcal
N/A
Weight per 100 calories
99g
357g
N/A
Fats
0.65g
0.4g
0%
Net carbs
17.06g
3.63g
N/A
Sugar
1.25g
N/A
Choline
0.4mg
0%
Saturated fat
0.052g
0%
Monounsaturated fat
0.03g
0%
Tryptophan
0.041mg
0.023mg
0%
Threonine
0.149mg
0.085mg
0%
Isoleucine
0.146mg
0.114mg
0%
Leucine
0.311mg
0.133mg
0%
Lysine
0.109mg
0.114mg
0%
Methionine
0.125mg
0.018mg
0%
Phenylalanine
0.203mg
0.097mg
0%
Valine
0.2mg
0.104mg
0%
Histidine
0.088mg
0.04mg
0%
Macronutrient Comparison
Macronutrient breakdown side-by-side comparison
3
4%
20%
75%
Protein:
3.87 g
Fats:
0.65 g
Carbs:
19.86 g
Water:
74.93 g
Other:
0.69 g
2
2%
6%
91%
Protein:
1.9 g
Fats:
0.4 g
Carbs:
5.63 g
Water:
91.2 g
Other:
0.87 g
Contains
more
Protein Protein
+103.7%
Contains
more
Fats Fats
+62.5%
Contains
more
Carbs Carbs
+252.8%
Contains
more
Water Water
+21.7%
Contains
more
Other Other
+26.1%