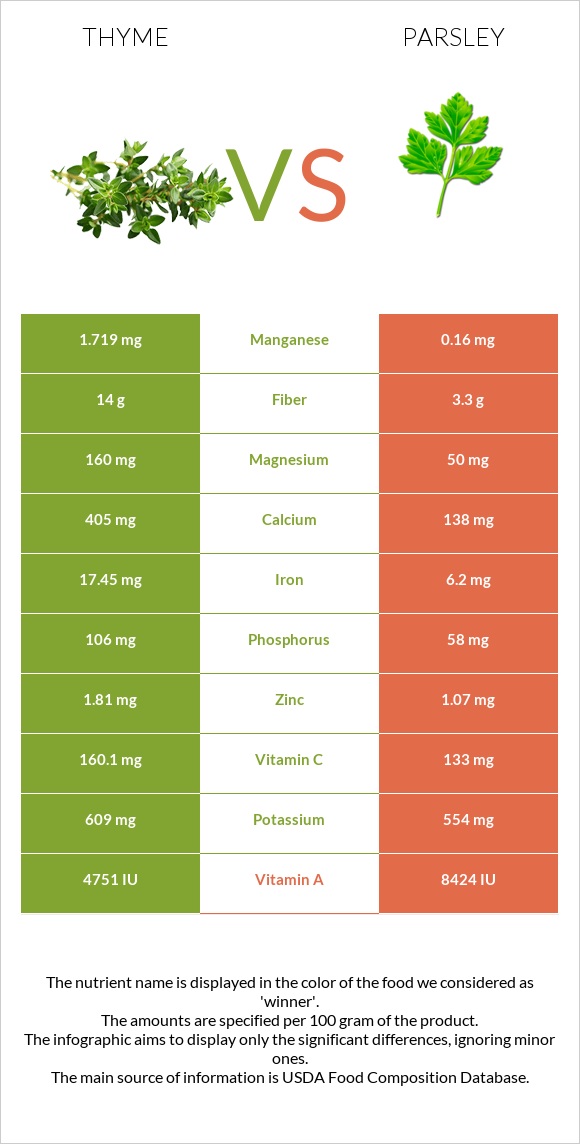
What are the main differences between thyme and parsley? Thyme is richer in iron, manganese, copper, fiber, vitamin C, vitamin B2, calcium, and magnesium, while parsley is higher in vitamin A and folate. Thyme's daily need coverage for iron is 141% higher. Parsley has 11 times less manganese than thyme. Thyme has 1.719mg of manganese, while parsley has 0.16mg. Thyme has a higher glycemic index (45) than parsley (32). We used Thyme, fresh and Parsley, fresh types in this comparison.
Infographic
Mineral Comparison
Mineral comparison score is based on the number of minerals by which one or the other food is richer. The "coverage" charts below show how much of the daily needs can be covered by 300 grams of the food.
8
100 g
300 g
0.5 tsp - 0.4g 1 tsp - 0.8g
Magnesium
Magnesium
Calcium
Calcium
Potassium
Potassium
Iron
Iron
Copper
Copper
Zinc
Zinc
Phosphorus
Phosphorus
Sodium
Sodium
Manganese
Manganese
Selenium
Selenium
114%
122%
54%
654%
185%
49%
45%
1.2%
224%
0%
1
100 g
300 g
1 tbsp - 3.8g 10 sprigs - 10g 1 cup chopped - 60g
Magnesium
Magnesium
Calcium
Calcium
Potassium
Potassium
Iron
Iron
Copper
Copper
Zinc
Zinc
Phosphorus
Phosphorus
Sodium
Sodium
Manganese
Manganese
Selenium
Selenium
36%
41%
49%
233%
50%
29%
25%
7.3%
21%
0.55%
Vitamin Comparison
Vitamin comparison score is based on the number of vitamins by which one or the other food is richer. The "coverage" charts below show how much of the daily needs can be covered by 300 grams of the food.
4
100 g
300 g
0.5 tsp - 0.4g 1 tsp - 0.8g
Vitamin C
Vit. C
Vitamin D
Vit. D
Vitamin A
Vit. A
Vitamin E
Vit. E
Vitamin B1
Vit. B1
Vitamin B2
Vit. B2
Vitamin B3
Vit. B3
Vitamin B5
Vit. B5
Vitamin B6
Vit. B6
Vitamin B12
Vit. B12
Vitamin K
Vit. K
Folate
Folate
534%
0%
79%
0%
12%
109%
34%
25%
80%
0%
0%
34%
5
100 g
300 g
1 tbsp - 3.8g 10 sprigs - 10g 1 cup chopped - 60g
Vitamin C
Vit. C
Vitamin D
Vit. D
Vitamin A
Vit. A
Vitamin E
Vit. E
Vitamin B1
Vit. B1
Vitamin B2
Vit. B2
Vitamin B3
Vit. B3
Vitamin B5
Vit. B5
Vitamin B6
Vit. B6
Vitamin B12
Vit. B12
Vitamin K
Vit. K
Folate
Folate
443%
0%
140%
15%
22%
23%
25%
24%
21%
0%
4100%
114%
All nutrients comparison - raw data values
Nutrient
DV% diff.
Vitamin K
1640µg
1367%
Iron
17.45mg
6.2mg
141%
Manganese
1.719mg
0.16mg
68%
Copper
0.555mg
0.149mg
45%
Fiber
14g
3.3g
43%
Vitamin C
160.1mg
133mg
30%
Vitamin B2
0.471mg
0.098mg
29%
Calcium
405mg
138mg
27%
Folate
45µg
152µg
27%
Magnesium
160mg
50mg
26%
Vitamin A
238µg
421µg
20%
Vitamin B6
0.348mg
0.09mg
20%
Zinc
1.81mg
1.07mg
7%
Phosphorus
106mg
58mg
7%
Carbs
24.45g
6.33g
6%
Protein
5.56g
2.97g
5%
Vitamin E
0.75mg
5%
Calories
101kcal
36kcal
3%
Vitamin B1
0.048mg
0.086mg
3%
Vitamin B3
1.824mg
1.313mg
3%
Polyunsaturated fat
0.532g
0.124g
3%
Potassium
609mg
554mg
2%
Sodium
9mg
56mg
2%
Choline
12.8mg
2%
Saturated fat
0.467g
0.132g
2%
Fats
1.68g
0.79g
1%
Monounsaturated fat
0.081g
0.295g
1%
Protein per 100 calories
5.5g
8.3g
N/A
Calories per 10 g protein
182kcal
121kcal
N/A
Weight per 100 calories
99g
278g
N/A
Net carbs
10.45g
3.03g
N/A
Sugar
0.85g
N/A
Selenium
0.1µg
0%
Vitamin B5
0.409mg
0.4mg
0%
Tryptophan
0.114mg
0.045mg
0%
Threonine
0.154mg
0.122mg
0%
Isoleucine
0.285mg
0.118mg
0%
Leucine
0.262mg
0.204mg
0%
Lysine
0.126mg
0.181mg
0%
Methionine
0.042mg
0%
Phenylalanine
0.145mg
0%
Valine
0.307mg
0.172mg
0%
Histidine
0.061mg
0%
Macronutrient Comparison
Macronutrient breakdown side-by-side comparison
4
6%
2%
24%
65%
3%
Protein:
5.56 g
Fats:
1.68 g
Carbs:
24.45 g
Water:
65.11 g
Other:
3.2 g
1
3%
6%
88%
2%
Protein:
2.97 g
Fats:
0.79 g
Carbs:
6.33 g
Water:
87.71 g
Other:
2.2 g
Contains
more
Protein Protein
+87.2%
Contains
more
Fats Fats
+112.7%
Contains
more
Carbs Carbs
+286.3%
Contains
more
Other Other
+45.5%
Contains
more
Water Water
+34.7%
Fat Type Comparison
Fat type breakdown side-by-side comparison
1
43%
8%
49%
Saturated fat:
Sat. Fat
0.467 g
Monounsaturated fat:
Mono. Fat
0.081 g
Polyunsaturated fat:
Poly. Fat
0.532 g
2
24%
54%
23%
Saturated fat:
Sat. Fat
0.132 g
Monounsaturated fat:
Mono. Fat
0.295 g
Polyunsaturated fat:
Poly. Fat
0.124 g
Contains
more
Poly. Fat Polyunsaturated fat
+329%
Contains
less
Sat. Fat Saturated fat
-71.7%
Contains
more
Mono. Fat Monounsaturated fat
+264.2%