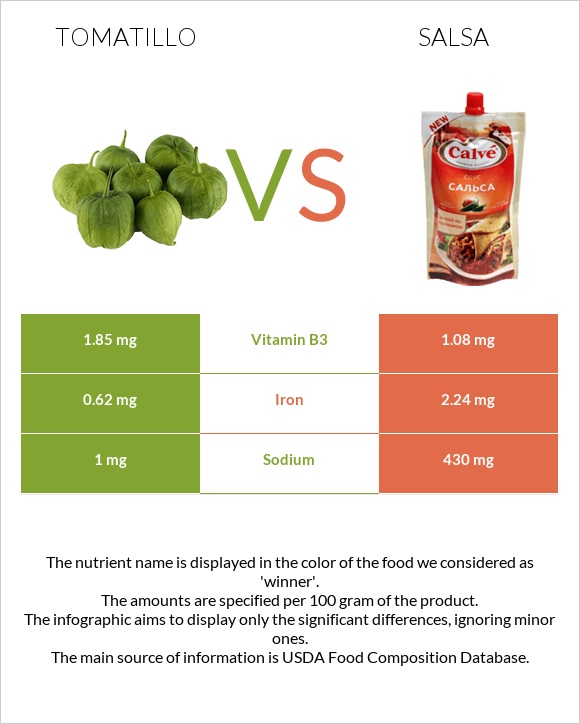
Important differences between tomatillos and salsa Tomatillos have more vitamin C; however, salsa has more iron, vitamin A, and vitamin B6. Salsa's daily need coverage for iron is 20% more. Tomatillos have 3 times more vitamin C than salsa. Tomatillos have 11.7mg of vitamin C, while salsa has 4mg. Tomatillos are lower in sodium. The food varieties used in the comparison are Tomatillos, raw and USDA Commodity, salsa .
Infographic
Mineral Comparison
Mineral comparison score is based on the number of minerals by which one or the other food is richer. The "coverage" charts below show how much of the daily needs can be covered by 300 grams of the food.
6
100 g
300 g
1 medium - 34g 0.5 cup, chopped or diced - 66g
Magnesium
Magnesium
Calcium
Calcium
Potassium
Potassium
Iron
Iron
Copper
Copper
Zinc
Zinc
Phosphorus
Phosphorus
Sodium
Sodium
Manganese
Manganese
Selenium
Selenium
14%
2.1%
24%
23%
26%
6%
17%
0.13%
19957%
2.7%
3
100 g
300 g
Magnesium
Magnesium
Calcium
Calcium
Potassium
Potassium
Iron
Iron
Copper
Copper
Zinc
Zinc
Phosphorus
Phosphorus
Sodium
Sodium
Manganese
Manganese
Selenium
Selenium
11%
3.6%
24%
84%
32%
4.6%
13%
56%
0%
2.2%
Vitamin Comparison
Vitamin comparison score is based on the number of vitamins by which one or the other food is richer. The "coverage" charts below show how much of the daily needs can be covered by 300 grams of the food.
6
100 g
300 g
1 medium - 34g 0.5 cup, chopped or diced - 66g
Vitamin C
Vit. C
Vitamin D
Vit. D
Vitamin A
Vit. A
Vitamin E
Vit. E
Vitamin B1
Vit. B1
Vitamin B2
Vit. B2
Vitamin B3
Vit. B3
Vitamin B5
Vit. B5
Vitamin B6
Vit. B6
Vitamin B12
Vit. B12
Vitamin K
Vit. K
Folate
Folate
39%
0%
2%
7.6%
11%
8.1%
35%
9%
13%
0%
25%
5.3%
4
100 g
300 g
Vitamin C
Vit. C
Vitamin D
Vit. D
Vitamin A
Vit. A
Vitamin E
Vit. E
Vitamin B1
Vit. B1
Vitamin B2
Vit. B2
Vitamin B3
Vit. B3
Vitamin B5
Vit. B5
Vitamin B6
Vit. B6
Vitamin B12
Vit. B12
Vitamin K
Vit. K
Folate
Folate
13%
0%
9.3%
0%
13%
6.9%
20%
0%
34%
0%
0%
14%
All nutrients comparison - raw data values
Nutrient
DV% diff.
Manganese
153mg
6652%
Iron
0.62mg
2.24mg
20%
Sodium
1mg
430mg
19%
Vitamin C
11.7mg
4mg
9%
Vitamin K
10.1µg
8%
Vitamin B6
0.056mg
0.149mg
7%
Vitamin B3
1.85mg
1.08mg
5%
Vitamin E
0.38mg
3%
Vitamin B5
0.15mg
3%
Folate
7µg
19µg
3%
Fiber
1.9g
1.4g
2%
Copper
0.079mg
0.096mg
2%
Vitamin A
6µg
28µg
2%
Polyunsaturated fat
0.417g
0.107g
2%
Protein
0.96g
1.5g
1%
Fats
1.02g
0.2g
1%
Magnesium
20mg
16mg
1%
Calcium
7mg
12mg
1%
Phosphorus
39mg
30mg
1%
Vitamin B1
0.044mg
0.05mg
1%
Choline
7.6mg
1%
Saturated fat
0.139g
0.029g
1%
Calories
32kcal
36kcal
0%
Protein per 100 calories
3g
4.2g
N/A
Calories per 10 g protein
333kcal
240kcal
N/A
Weight per 100 calories
313g
278g
N/A
Net carbs
3.94g
5.6g
N/A
Carbs
5.84g
7g
0%
Potassium
268mg
270mg
0%
Sugar
3.93g
N/A
Zinc
0.22mg
0.17mg
0%
Selenium
0.5µg
0.4µg
0%
Vitamin B2
0.035mg
0.03mg
0%
Monounsaturated fat
0.155g
0.016g
0%
Macronutrient Comparison
Macronutrient breakdown side-by-side comparison
2
6%
92%
Protein:
0.96 g
Fats:
1.02 g
Carbs:
5.84 g
Water:
91.63 g
Other:
0.55 g
3
7%
90%
Protein:
1.5 g
Fats:
0.2 g
Carbs:
7 g
Water:
89.7 g
Other:
1.6 g
Contains
more
Fats Fats
+410%
Contains
more
Protein Protein
+56.3%
Contains
more
Carbs Carbs
+19.9%
Contains
more
Other Other
+190.9%
Fat Type Comparison
Fat type breakdown side-by-side comparison
2
20%
22%
59%
Saturated fat:
Sat. Fat
0.139 g
Monounsaturated fat:
Mono. Fat
0.155 g
Polyunsaturated fat:
Poly. Fat
0.417 g
1
19%
11%
70%
Saturated fat:
Sat. Fat
0.029 g
Monounsaturated fat:
Mono. Fat
0.016 g
Polyunsaturated fat:
Poly. Fat
0.107 g
Contains
more
Mono. Fat Monounsaturated fat
+868.8%
Contains
more
Poly. Fat Polyunsaturated fat
+289.7%
Contains
less
Sat. Fat Saturated fat
-79.1%