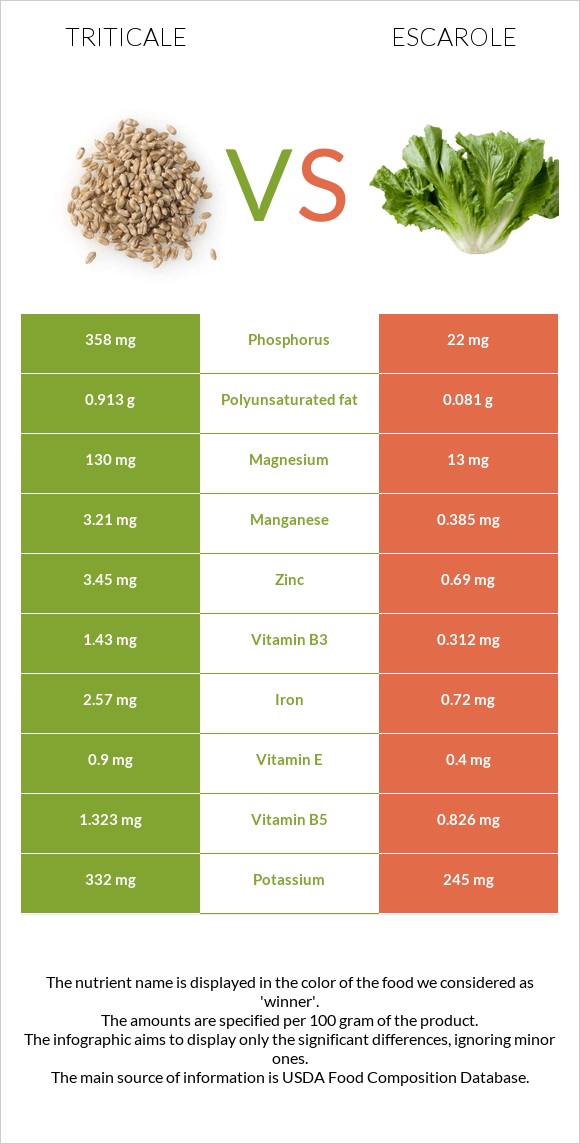
Summary of differences between triticale and escarole Triticale has more manganese, phosphorus, copper, vitamin B1, magnesium, zinc, iron, vitamin B5, and vitamin B6; however, escarole is higher in vitamin A. Triticale covers your daily need for manganese, 123% more than escarole. Triticale has 16 times more phosphorus than escarole. While triticale has 358mg of phosphorus, escarole has only 22mg. The glycemic index of triticale is higher. These are the specific foods used in this comparison Triticale and Escarole, cooked, boiled, drained, no salt added .
Infographic
Mineral Comparison
Mineral comparison score is based on the number of minerals by which one or the other food is richer. The "coverage" charts below show how much of the daily needs can be covered by 300 grams of the food.
8
100 g
300 g
1 cup - 192g
Magnesium
Magnesium
Calcium
Calcium
Potassium
Potassium
Iron
Iron
Copper
Copper
Zinc
Zinc
Phosphorus
Phosphorus
Sodium
Sodium
Manganese
Manganese
Selenium
Selenium
93%
11%
29%
96%
152%
94%
153%
0.65%
419%
0%
2
100 g
300 g
1 cup - 150g
Magnesium
Magnesium
Calcium
Calcium
Potassium
Potassium
Iron
Iron
Copper
Copper
Zinc
Zinc
Phosphorus
Phosphorus
Sodium
Sodium
Manganese
Manganese
Selenium
Selenium
9.3%
14%
22%
27%
29%
19%
9.4%
2.5%
50%
1.1%
Vitamin Comparison
Vitamin comparison score is based on the number of vitamins by which one or the other food is richer. The "coverage" charts below show how much of the daily needs can be covered by 300 grams of the food.
6
100 g
300 g
1 cup - 192g
Vitamin C
Vit. C
Vitamin D
Vit. D
Vitamin A
Vit. A
Vitamin E
Vit. E
Vitamin B1
Vit. B1
Vitamin B2
Vit. B2
Vitamin B3
Vit. B3
Vitamin B5
Vit. B5
Vitamin B6
Vit. B6
Vitamin B12
Vit. B12
Vitamin K
Vit. K
Folate
Folate
0%
0%
0%
18%
104%
31%
27%
79%
32%
0%
0%
55%
3
100 g
300 g
1 cup - 150g
Vitamin C
Vit. C
Vitamin D
Vit. D
Vitamin A
Vit. A
Vitamin E
Vit. E
Vitamin B1
Vit. B1
Vitamin B2
Vit. B2
Vitamin B3
Vit. B3
Vitamin B5
Vit. B5
Vitamin B6
Vit. B6
Vitamin B12
Vit. B12
Vitamin K
Vit. K
Folate
Folate
11%
0%
31%
8%
15%
14%
5.9%
50%
3.7%
0%
530%
59%
All nutrients comparison - raw data values
Nutrient
DV% diff.
Vitamin K
211.9µg
177%
Manganese
3.21mg
0.385mg
123%
Phosphorus
358mg
22mg
48%
Copper
0.457mg
0.087mg
41%
Vitamin B1
0.416mg
0.059mg
30%
Magnesium
130mg
13mg
28%
Zinc
3.45mg
0.69mg
25%
Protein
13.05g
1.15g
24%
Carbs
72.13g
3.07g
23%
Iron
2.57mg
0.72mg
23%
Calories
336kcal
19kcal
16%
Fiber
2.8g
11%
Vitamin A
0µg
94µg
10%
Vitamin B5
1.323mg
0.826mg
10%
Vitamin B6
0.138mg
0.016mg
9%
Vitamin B3
1.43mg
0.312mg
7%
Vitamin B2
0.134mg
0.062mg
6%
Polyunsaturated fat
0.913g
0.081g
6%
Vitamin C
0mg
3.3mg
4%
Fats
2.09g
0.18g
3%
Potassium
332mg
245mg
3%
Vitamin E
0.9mg
0.4mg
3%
Choline
15.4mg
3%
Calcium
37mg
46mg
1%
Sodium
5mg
19mg
1%
Folate
73µg
78µg
1%
Saturated fat
0.366g
0.042g
1%
Monounsaturated fat
0.211g
0.004g
1%
Protein per 100 calories
3.9g
6.1g
N/A
Calories per 10 g protein
257kcal
165kcal
N/A
Weight per 100 calories
30g
526g
N/A
Unsaturated / Saturated Fat ratio
3.1
2
N/A
Net carbs
72.13g
0.27g
N/A
Sugar
0.23g
N/A
Selenium
0.2µg
0%
Tryptophan
0.157mg
0.005mg
0%
Threonine
0.405mg
0.046mg
0%
Isoleucine
0.479mg
0.066mg
0%
Leucine
0.911mg
0.09mg
0%
Lysine
0.365mg
0.058mg
0%
Methionine
0.204mg
0.013mg
0%
Phenylalanine
0.638mg
0.049mg
0%
Valine
0.609mg
0.058mg
0%
Histidine
0.311mg
0.021mg
0%
Macronutrient Comparison
Macronutrient breakdown side-by-side comparison
4
13%
2%
72%
11%
2%
Protein:
13.05 g
Fats:
2.09 g
Carbs:
72.13 g
Water:
10.51 g
Other:
2.22 g
1
3%
94%
Protein:
1.15 g
Fats:
0.18 g
Carbs:
3.07 g
Water:
94.29 g
Other:
1.31 g
Contains
more
Protein Protein
+1034.8%
Contains
more
Fats Fats
+1061.1%
Contains
more
Carbs Carbs
+2249.5%
Contains
more
Other Other
+69.5%
Contains
more
Water Water
+797.1%
Fat Type Comparison
Fat type breakdown side-by-side comparison
2
25%
14%
61%
Saturated fat:
Sat. Fat
0.366 g
Monounsaturated fat:
Mono. Fat
0.211 g
Polyunsaturated fat:
Poly. Fat
0.913 g
1
33%
3%
64%
Saturated fat:
Sat. Fat
0.042 g
Monounsaturated fat:
Mono. Fat
0.004 g
Polyunsaturated fat:
Poly. Fat
0.081 g
Contains
more
Mono. Fat Monounsaturated fat
+5175%
Contains
more
Poly. Fat Polyunsaturated fat
+1027.2%
Contains
less
Sat. Fat Saturated fat
-88.5%