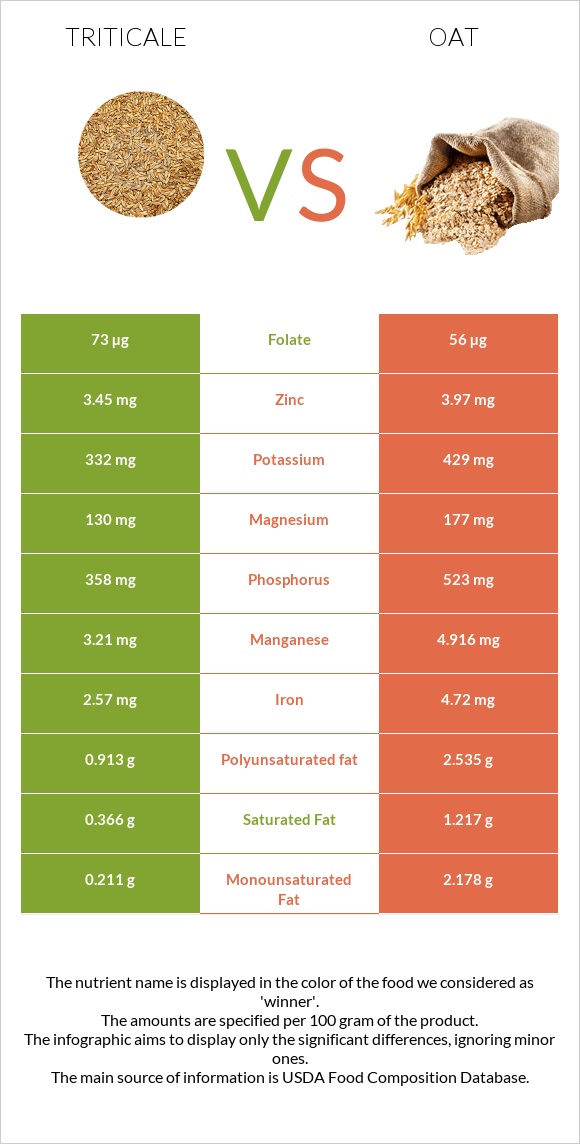
What are the differences between triticale and oats? The amount of manganese, vitamin B1, iron, phosphorus, copper, and magnesium in oats is higher than in triticale. Oats' daily need coverage for manganese is 74% more. Triticale has less saturated fat. We used Triticale and Oats types in this article.
Infographic
Mineral Comparison
Mineral comparison score is based on the number of minerals by which one or the other food is richer. The "coverage" charts below show how much of the daily needs can be covered by 300 grams of the food.
0
100 g
300 g
1 cup - 192g
Magnesium
Magnesium
Calcium
Calcium
Potassium
Potassium
Iron
Iron
Copper
Copper
Zinc
Zinc
Phosphorus
Phosphorus
Sodium
Sodium
Manganese
Manganese
Selenium
Selenium
93%
11%
29%
96%
152%
94%
153%
0.65%
419%
0%
9
100 g
300 g
1 cup - 156g
Magnesium
Magnesium
Calcium
Calcium
Potassium
Potassium
Iron
Iron
Copper
Copper
Zinc
Zinc
Phosphorus
Phosphorus
Sodium
Sodium
Manganese
Manganese
Selenium
Selenium
126%
16%
38%
177%
209%
108%
224%
0.26%
641%
0%
Vitamin Comparison
Vitamin comparison score is based on the number of vitamins by which one or the other food is richer. The "coverage" charts below show how much of the daily needs can be covered by 300 grams of the food.
4
100 g
300 g
1 cup - 192g
Vitamin C
Vit. C
Vitamin D
Vit. D
Vitamin A
Vit. A
Vitamin E
Vit. E
Vitamin B1
Vit. B1
Vitamin B2
Vit. B2
Vitamin B3
Vit. B3
Vitamin B5
Vit. B5
Vitamin B6
Vit. B6
Vitamin B12
Vit. B12
Vitamin K
Vit. K
Folate
Folate
0%
0%
0%
18%
104%
31%
27%
79%
32%
0%
0%
55%
1
100 g
300 g
1 cup - 156g
Vitamin C
Vit. C
Vitamin D
Vit. D
Vitamin A
Vit. A
Vitamin E
Vit. E
Vitamin B1
Vit. B1
Vitamin B2
Vit. B2
Vitamin B3
Vit. B3
Vitamin B5
Vit. B5
Vitamin B6
Vit. B6
Vitamin B12
Vit. B12
Vitamin K
Vit. K
Folate
Folate
0%
0%
0%
0%
191%
32%
18%
81%
27%
0%
0%
42%
All nutrients comparison - raw data values
Nutrient
DV% diff.
Manganese
3.21mg
4.916mg
74%
Fiber
10.6g
42%
Vitamin B1
0.416mg
0.763mg
29%
Iron
2.57mg
4.72mg
27%
Phosphorus
358mg
523mg
24%
Copper
0.457mg
0.626mg
19%
Magnesium
130mg
177mg
11%
Polyunsaturated fat
0.913g
2.535g
11%
Protein
13.05g
16.89g
8%
Fats
2.09g
6.9g
7%
Vitamin E
0.9mg
6%
Zinc
3.45mg
3.97mg
5%
Monounsaturated fat
0.211g
2.178g
5%
Folate
73µg
56µg
4%
Saturated fat
0.366g
1.217g
4%
Calories
336kcal
389kcal
3%
Potassium
332mg
429mg
3%
Vitamin B3
1.43mg
0.961mg
3%
Carbs
72.13g
66.27g
2%
Calcium
37mg
54mg
2%
Vitamin B5
1.323mg
1.349mg
1%
Vitamin B6
0.138mg
0.119mg
1%
Protein per 100 calories
3.9g
4.3g
N/A
Calories per 10 g protein
257kcal
230kcal
N/A
Weight per 100 calories
30g
26g
N/A
Unsaturated / Saturated Fat ratio
3.1
3.9
N/A
Net carbs
72.13g
55.67g
N/A
Sodium
5mg
2mg
0%
Vitamin B2
0.134mg
0.139mg
0%
Tryptophan
0.157mg
0.234mg
0%
Threonine
0.405mg
0.575mg
0%
Isoleucine
0.479mg
0.694mg
0%
Leucine
0.911mg
1.284mg
0%
Lysine
0.365mg
0.701mg
0%
Methionine
0.204mg
0.312mg
0%
Phenylalanine
0.638mg
0.895mg
0%
Valine
0.609mg
0.937mg
0%
Histidine
0.311mg
0.405mg
0%
Macronutrient Comparison
Macronutrient breakdown side-by-side comparison
3
13%
2%
72%
11%
2%
Protein:
13.05 g
Fats:
2.09 g
Carbs:
72.13 g
Water:
10.51 g
Other:
2.22 g
2
17%
7%
66%
8%
2%
Protein:
16.89 g
Fats:
6.9 g
Carbs:
66.27 g
Water:
8.22 g
Other:
1.72 g
Contains
more
Water Water
+27.9%
Contains
more
Other Other
+29.1%
Contains
more
Protein Protein
+29.4%
Contains
more
Fats Fats
+230.1%
Fat Type Comparison
Fat type breakdown side-by-side comparison
1
25%
14%
61%
Saturated fat:
Sat. Fat
0.366 g
Monounsaturated fat:
Mono. Fat
0.211 g
Polyunsaturated fat:
Poly. Fat
0.913 g
2
21%
37%
43%
Saturated fat:
Sat. Fat
1.217 g
Monounsaturated fat:
Mono. Fat
2.178 g
Polyunsaturated fat:
Poly. Fat
2.535 g
Contains
less
Sat. Fat Saturated fat
-69.9%
Contains
more
Mono. Fat Monounsaturated fat
+932.2%
Contains
more
Poly. Fat Polyunsaturated fat
+177.7%