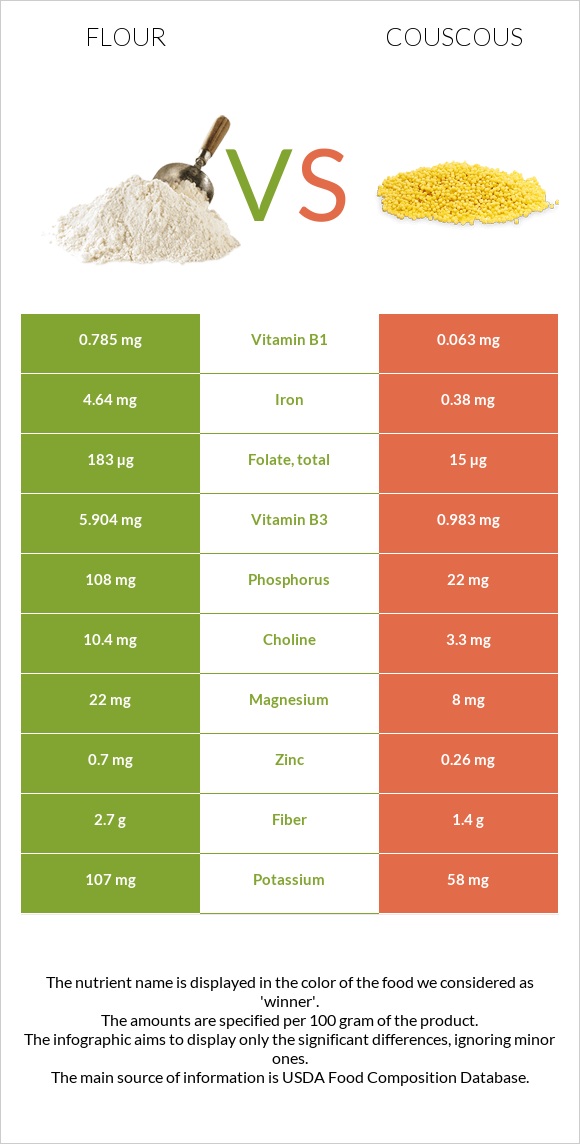
Significant differences between flour and couscous The amount of vitamin B1, iron, folate, vitamin B2, vitamin B3, manganese, phosphorus, selenium, copper, and fiber in flour is higher than in couscous. Flour covers your daily vitamin B1 needs 60% more than couscous. Couscous has 18 times less vitamin B2 than flour. Flour has 0.494mg of vitamin B2, while couscous has 0.027mg. Specific food types used in this comparison are Wheat flour, white, all-purpose, enriched, bleached and Couscous, cooked .
Infographic
Mineral Comparison
Mineral comparison score is based on the number of minerals by which one or the other food is richer. The "coverage" charts below show how much of the daily needs can be covered by 300 grams of the food.
10
100 g
300 g
1 cup - 125g
Magnesium
Magnesium
Calcium
Calcium
Potassium
Potassium
Iron
Iron
Copper
Copper
Zinc
Zinc
Phosphorus
Phosphorus
Sodium
Sodium
Manganese
Manganese
Selenium
Selenium
16%
4.5%
9.4%
174%
48%
19%
46%
0.26%
89%
185%
0
100 g
300 g
1 oz, dry, yields - 86g 1 cup, cooked - 157g 1 cup, dry, yields - 528g
Magnesium
Magnesium
Calcium
Calcium
Potassium
Potassium
Iron
Iron
Copper
Copper
Zinc
Zinc
Phosphorus
Phosphorus
Sodium
Sodium
Manganese
Manganese
Selenium
Selenium
5.7%
2.4%
5.1%
14%
14%
7.1%
9.4%
0.65%
11%
150%
Vitamin Comparison
Vitamin comparison score is based on the number of vitamins by which one or the other food is richer. The "coverage" charts below show how much of the daily needs can be covered by 300 grams of the food.
6
100 g
300 g
1 cup - 125g
Vitamin C
Vit. C
Vitamin D
Vit. D
Vitamin A
Vit. A
Vitamin E
Vit. E
Vitamin B1
Vit. B1
Vitamin B2
Vit. B2
Vitamin B3
Vit. B3
Vitamin B5
Vit. B5
Vitamin B6
Vit. B6
Vitamin B12
Vit. B12
Vitamin K
Vit. K
Folate
Folate
0%
0%
0%
1.2%
196%
114%
111%
26%
10%
0%
0.75%
137%
2
100 g
300 g
1 oz, dry, yields - 86g 1 cup, cooked - 157g 1 cup, dry, yields - 528g
Vitamin C
Vit. C
Vitamin D
Vit. D
Vitamin A
Vit. A
Vitamin E
Vit. E
Vitamin B1
Vit. B1
Vitamin B2
Vit. B2
Vitamin B3
Vit. B3
Vitamin B5
Vit. B5
Vitamin B6
Vit. B6
Vitamin B12
Vit. B12
Vitamin K
Vit. K
Folate
Folate
0%
0%
0%
2.6%
16%
6.2%
18%
22%
12%
0%
0.25%
11%
All nutrients comparison - raw data values
Nutrient
DV% diff.
Vitamin B1
0.785mg
0.063mg
60%
Iron
4.64mg
0.38mg
53%
Folate
183µg
15µg
42%
Vitamin B2
0.494mg
0.027mg
36%
Vitamin B3
5.904mg
0.983mg
31%
Manganese
0.682mg
0.084mg
26%
Carbs
76.31g
23.22g
18%
Calories
364kcal
112kcal
13%
Protein
10.33g
3.79g
13%
Phosphorus
108mg
22mg
12%
Selenium
33.9µg
27.5µg
12%
Copper
0.144mg
0.041mg
11%
Fiber
2.7g
1.4g
5%
Zinc
0.7mg
0.26mg
4%
Magnesium
22mg
8mg
3%
Polyunsaturated fat
0.413g
0.064g
2%
Fats
0.98g
0.16g
1%
Calcium
15mg
8mg
1%
Potassium
107mg
58mg
1%
Vitamin B5
0.438mg
0.371mg
1%
Vitamin B6
0.044mg
0.051mg
1%
Choline
10.4mg
3.3mg
1%
Saturated fat
0.155g
0.029g
1%
Protein per 100 calories
2.8g
3.4g
N/A
Calories per 10 g protein
352kcal
296kcal
N/A
Weight per 100 calories
27g
89g
N/A
Net carbs
73.61g
21.82g
N/A
Sugar
0.27g
0.1g
N/A
Sodium
2mg
5mg
0%
Vitamin E
0.06mg
0.13mg
0%
Vitamin K
0.3µg
0.1µg
0%
Monounsaturated fat
0.087g
0.022g
0%
Tryptophan
0.127mg
0.049mg
0%
Threonine
0.281mg
0.1mg
0%
Isoleucine
0.357mg
0.147mg
0%
Leucine
0.71mg
0.259mg
0%
Lysine
0.228mg
0.073mg
0%
Methionine
0.183mg
0.059mg
0%
Phenylalanine
0.52mg
0.184mg
0%
Valine
0.415mg
0.162mg
0%
Histidine
0.23mg
0.077mg
0%
Macronutrient Comparison
Macronutrient breakdown side-by-side comparison
4
10%
76%
12%
Protein:
10.33 g
Fats:
0.98 g
Carbs:
76.31 g
Water:
11.92 g
Other:
0.46 g
1
4%
23%
73%
Protein:
3.79 g
Fats:
0.16 g
Carbs:
23.22 g
Water:
72.57 g
Other:
0.26 g
Contains
more
Protein Protein
+172.6%
Contains
more
Fats Fats
+512.5%
Contains
more
Carbs Carbs
+228.6%
Contains
more
Other Other
+76.9%
Contains
more
Water Water
+508.8%
Fat Type Comparison
Fat type breakdown side-by-side comparison
2
24%
13%
63%
Saturated fat:
Sat. Fat
0.155 g
Monounsaturated fat:
Mono. Fat
0.087 g
Polyunsaturated fat:
Poly. Fat
0.413 g
1
25%
19%
56%
Saturated fat:
Sat. Fat
0.029 g
Monounsaturated fat:
Mono. Fat
0.022 g
Polyunsaturated fat:
Poly. Fat
0.064 g
Contains
more
Mono. Fat Monounsaturated fat
+295.5%
Contains
more
Poly. Fat Polyunsaturated fat
+545.3%
Contains
less
Sat. Fat Saturated fat
-81.3%